Discover the Card Explore Filters nestled within the Explore section of the Admin Page, empowering you to effortlessly pinpoint cards tailored to your desired metrics. 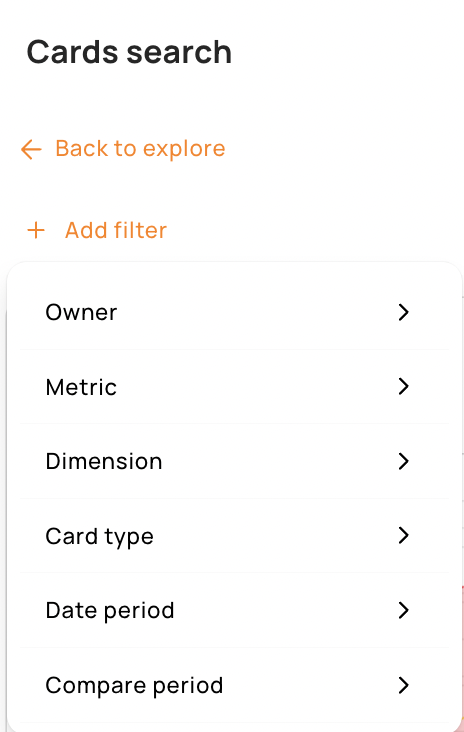
Owner: This filter allows you to look either for
- Tenzo cards: These cards are standard cards created and owned by Tenzo. They all use standard metric names and are built in a consistent manner following best practices.
- Cards specific to your business: These cards have been created manually (most likely by your CSM) to answer an advanced/custom use case
Metric: This filter allows you to look for cards based on the key performance indicator (KPI) you are interested in e.g. transactions, item price, sales etc.
Dimensions: Dimensions are ways to break down a metric and are useful to conduct benchmarks. For instance, you can be interested in looking at your Sales (metric) by Location (dimension), or your cost of labour % sales (metric) by Revenue centre (dimension).
Card filters: Card filters can be useful if you want to focus on a specific dimension. For instance, you might want to look into your sales by location but want the ability to drill down into specific categories or items. In this case you would look for a card with the metric Sales, the dimension Location and a card filter Category or Item.
Card type: This filter allows you to see cards that match your preferred visualisation type. If you’re looking for detailed analysis you might want to see a table, but if you are building a simple dashboard for your GMs you might want to use scorecard, line chart, which might convey high level information in a more impactful way.
Date period: The date period filter refers to the default date range applied to the card. If you are building a dashboard to help your team optimise the weekly performance you might want all your cards to be “week to date” cards but if you’re interested in long term performance analysis you might prefer “Quarter to date” or “Year to date” ones.
Compare period: Compare periods allows you to conduct comparative analysis and to assess changes over time within your data. It’s a way to add some context to your performance analysis and to be able to quickly see if your key performance indicators are going in the right direction by comparing where you are now with the previous week or the same time last year, etc.


