When you navigate a Module through the Web and Mobile App, you have two different ways of looking at a metric: Snapshot or Trends.
What is Snapshot? #
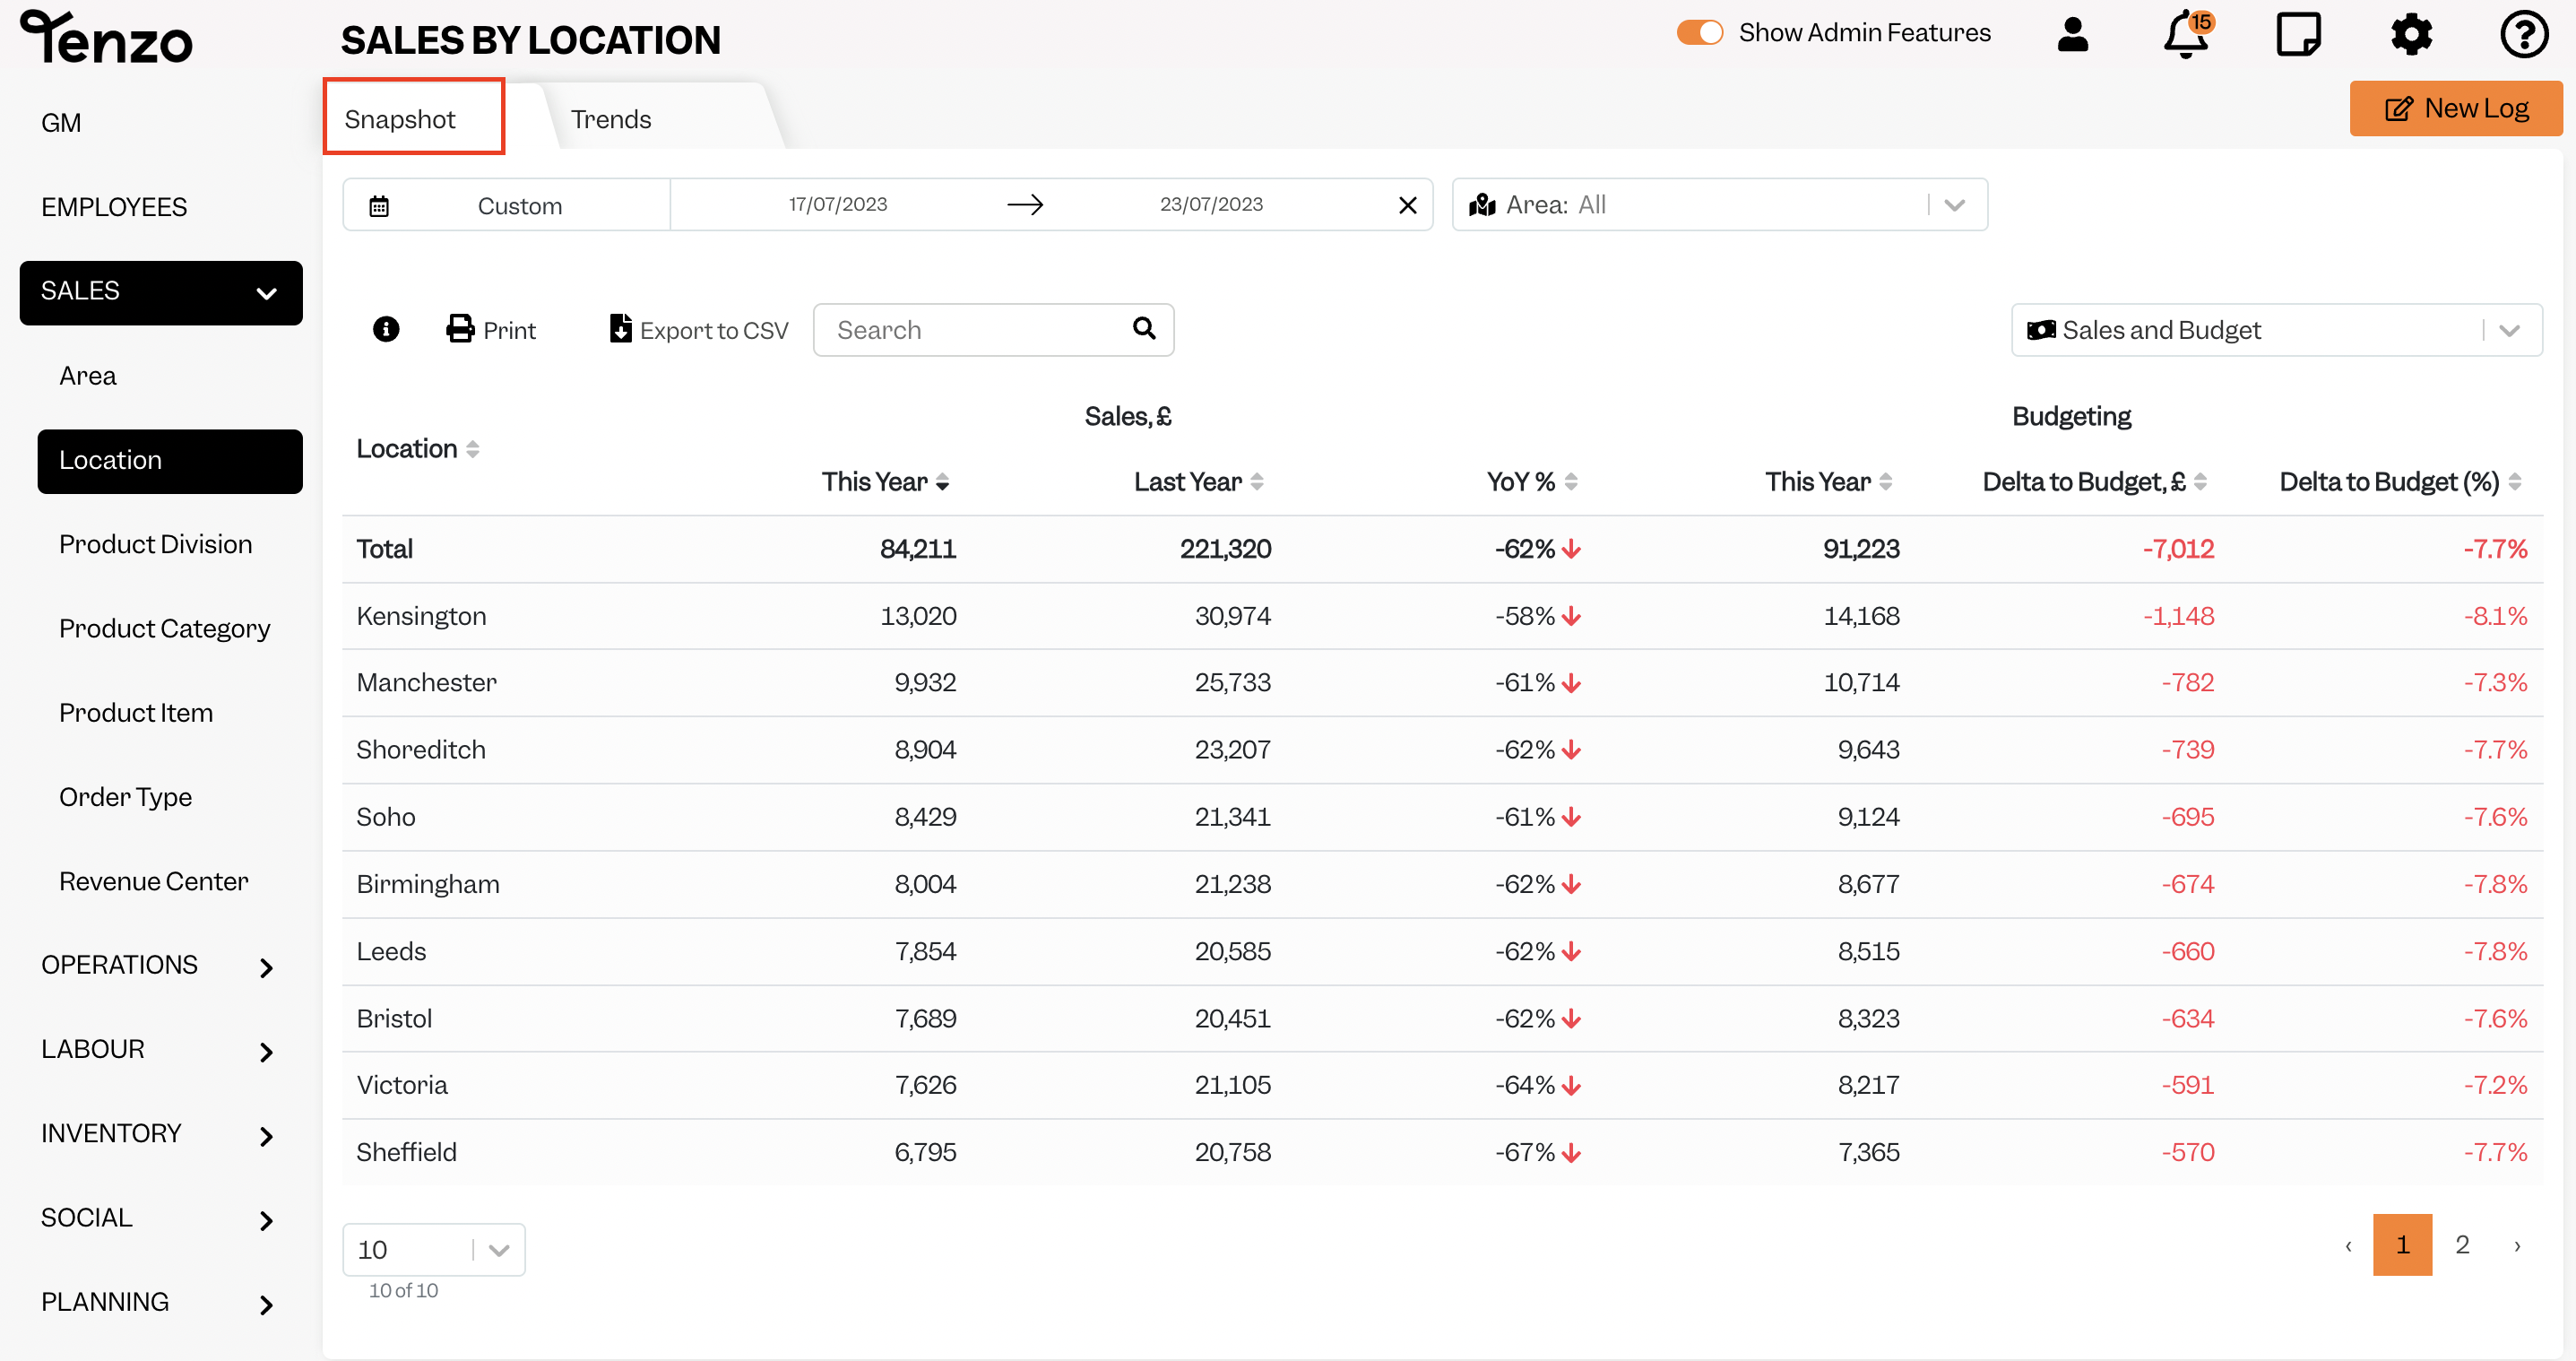
The Snapshot will show you a quick overview of your data in a table format, where you can easily spot overall results.
If you click on Sales by Location, it will show the overall sales for the selected date range by each location.
However, if you want to see the details by day, week, or month you can then switch to Trends.
What is Trends? #
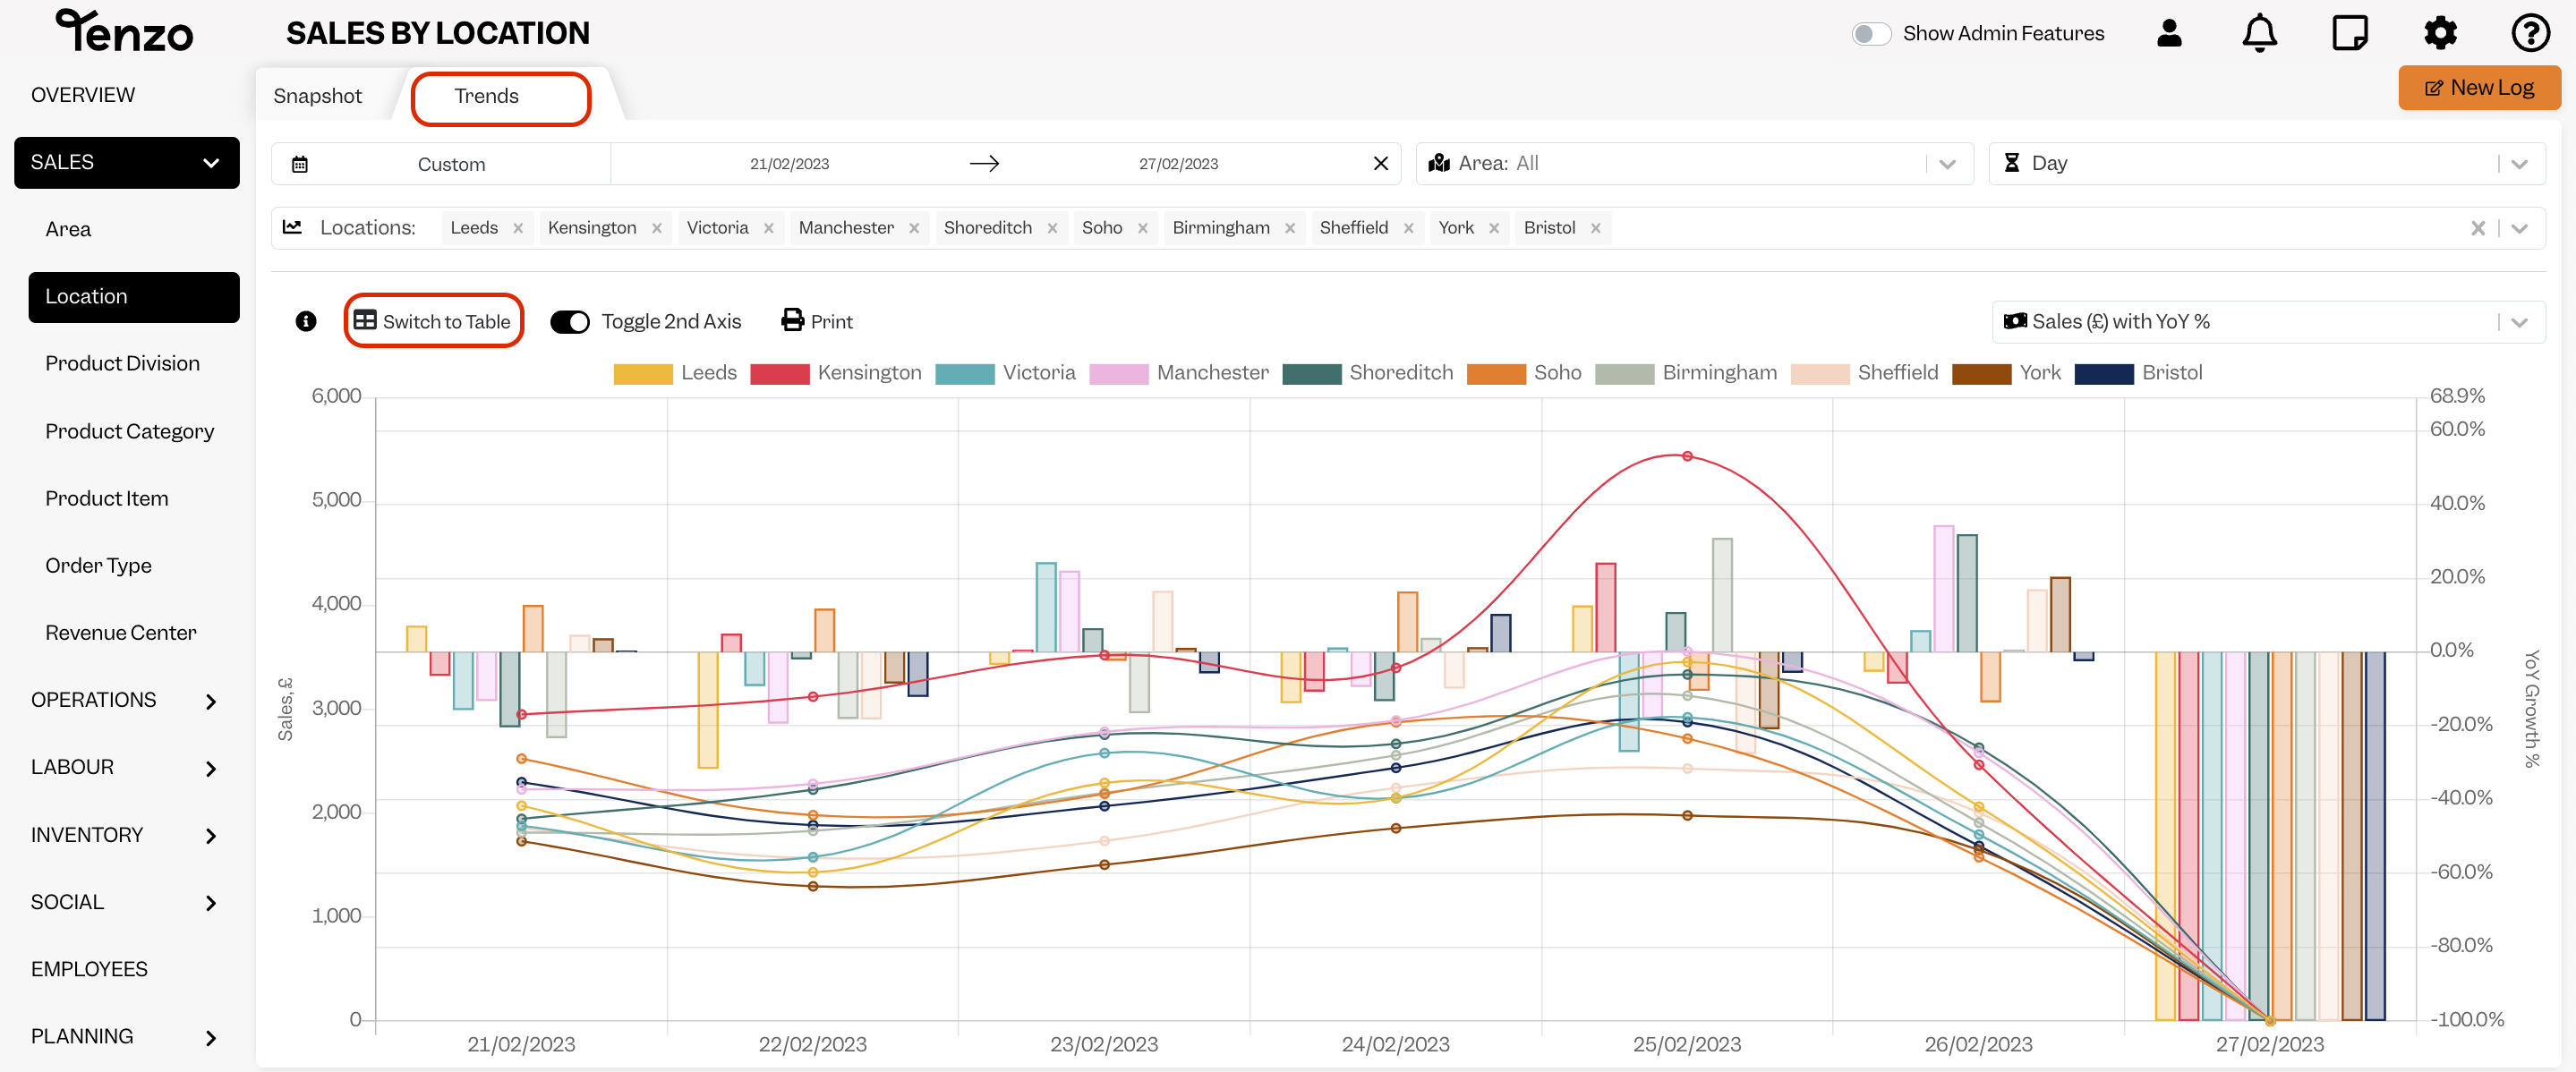
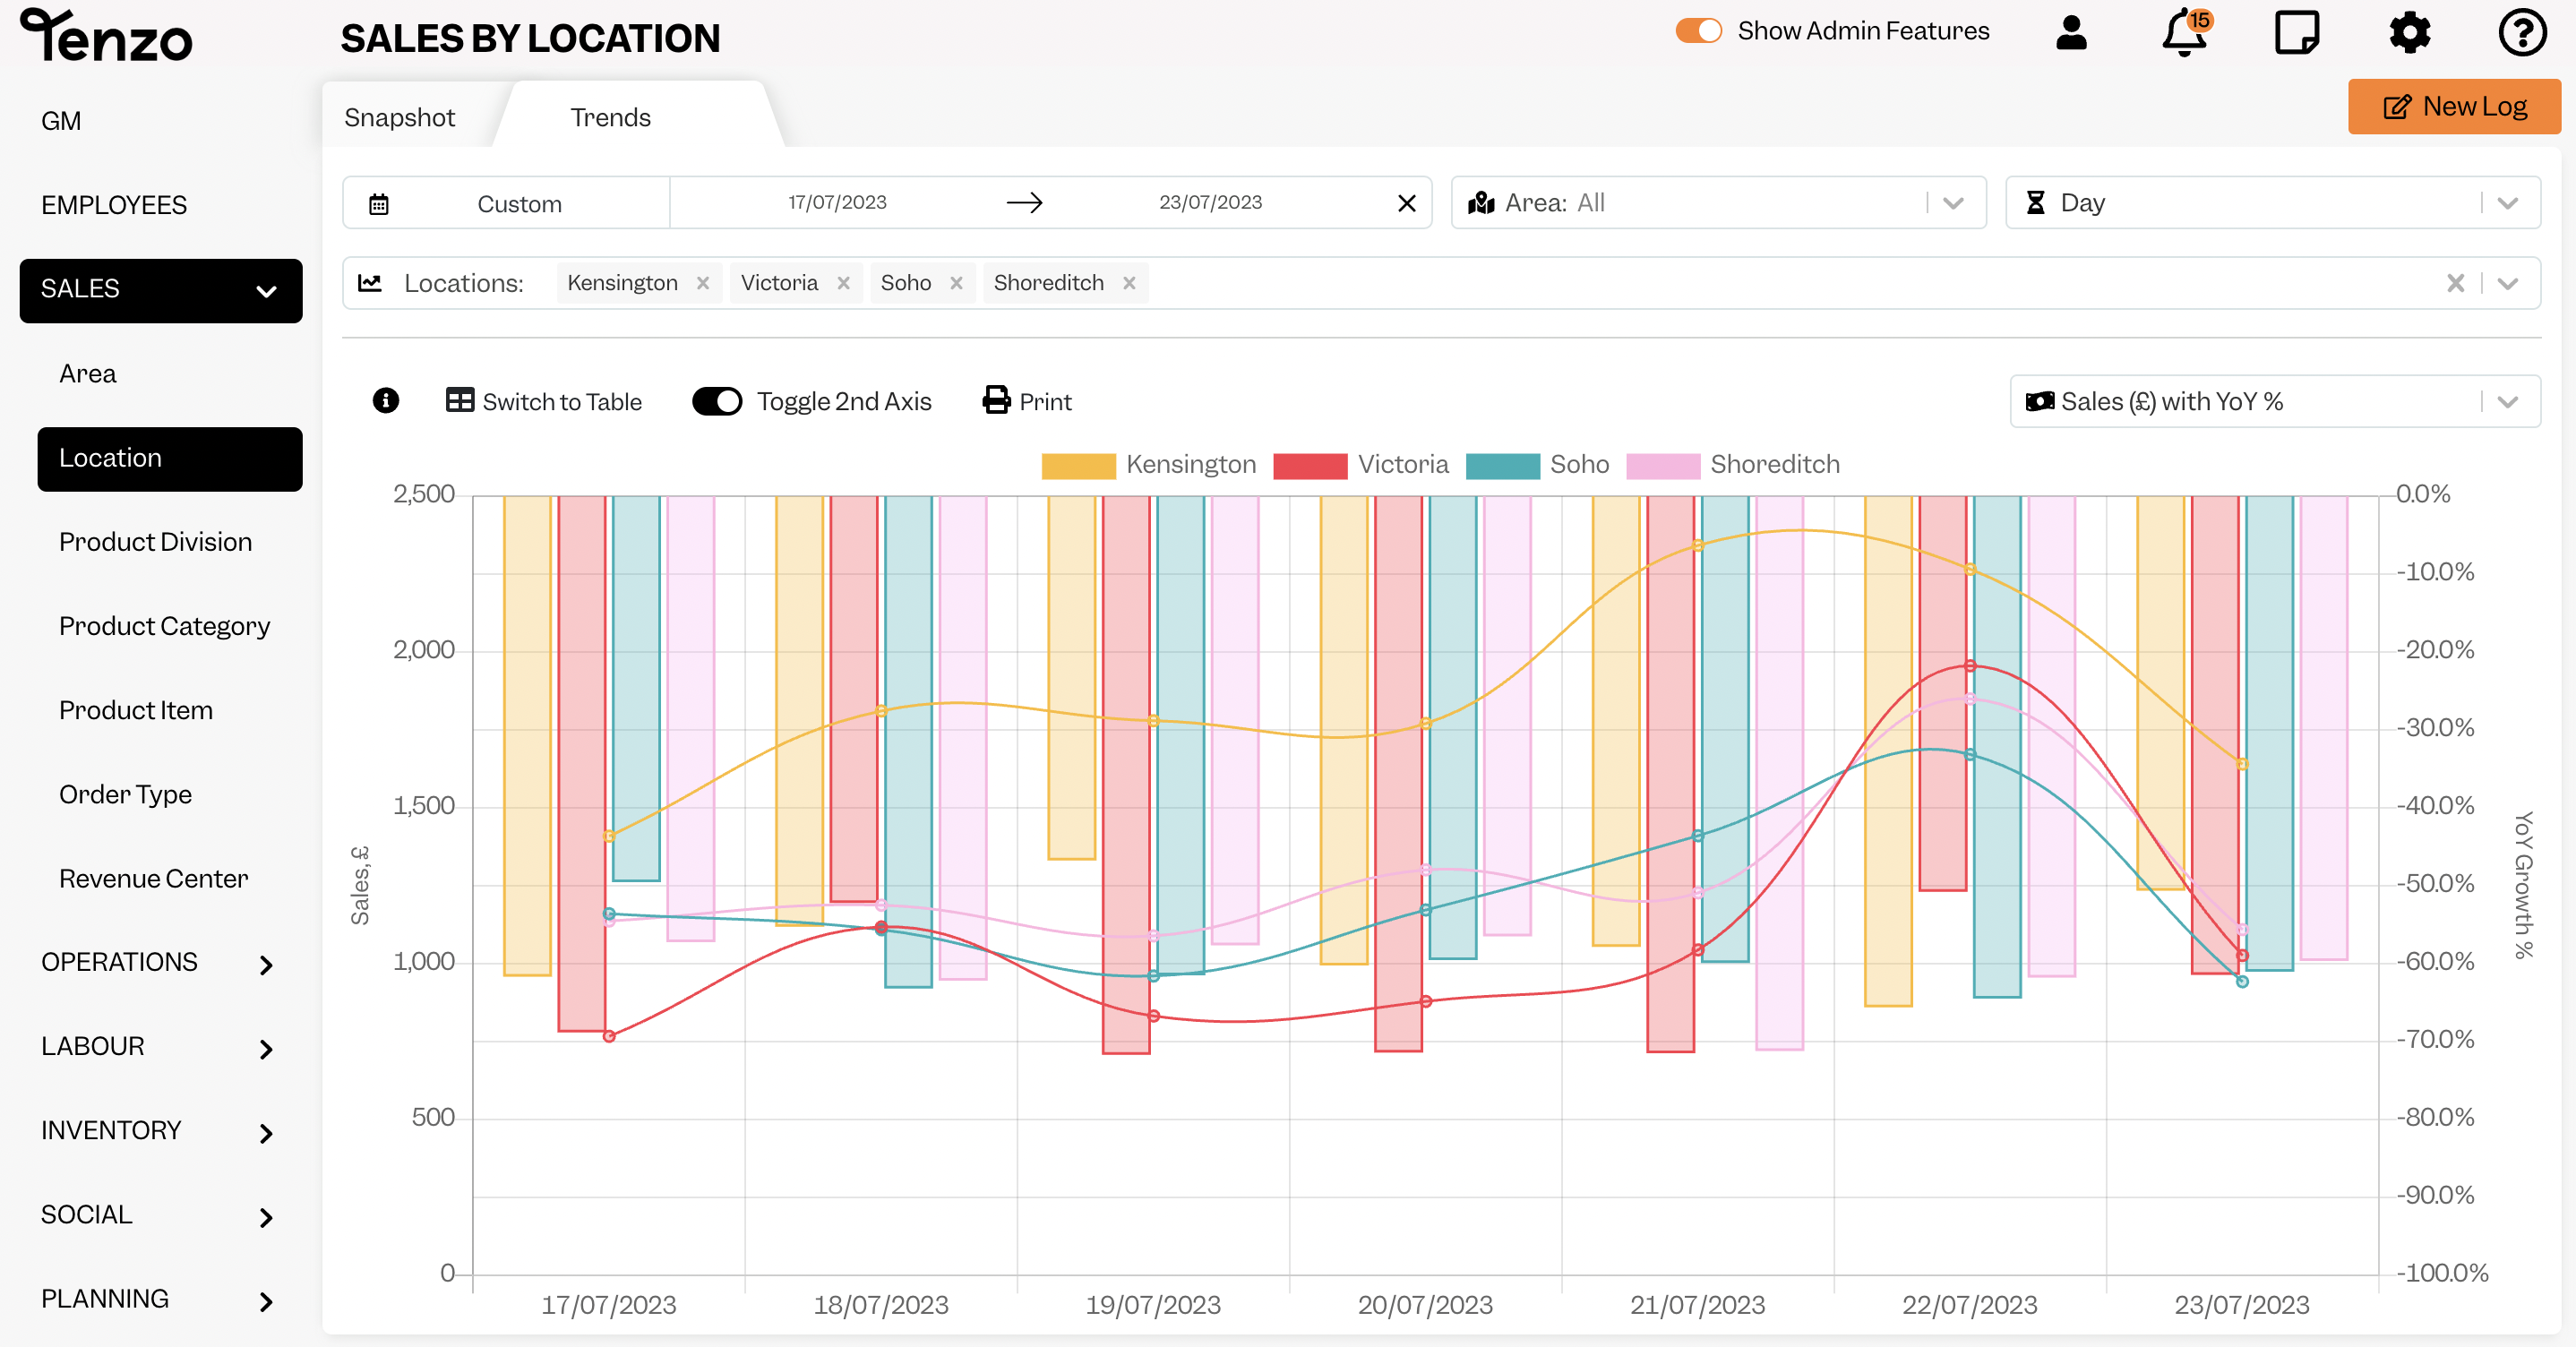
Trends is a detailed report that focuses on breaking down your daily, weekly or monthly data shown in a chart or table.
If you then click on “Switch to Table”, the graphic above will be shown as the following table.
This function allows you to toggle between a Chart or Table.
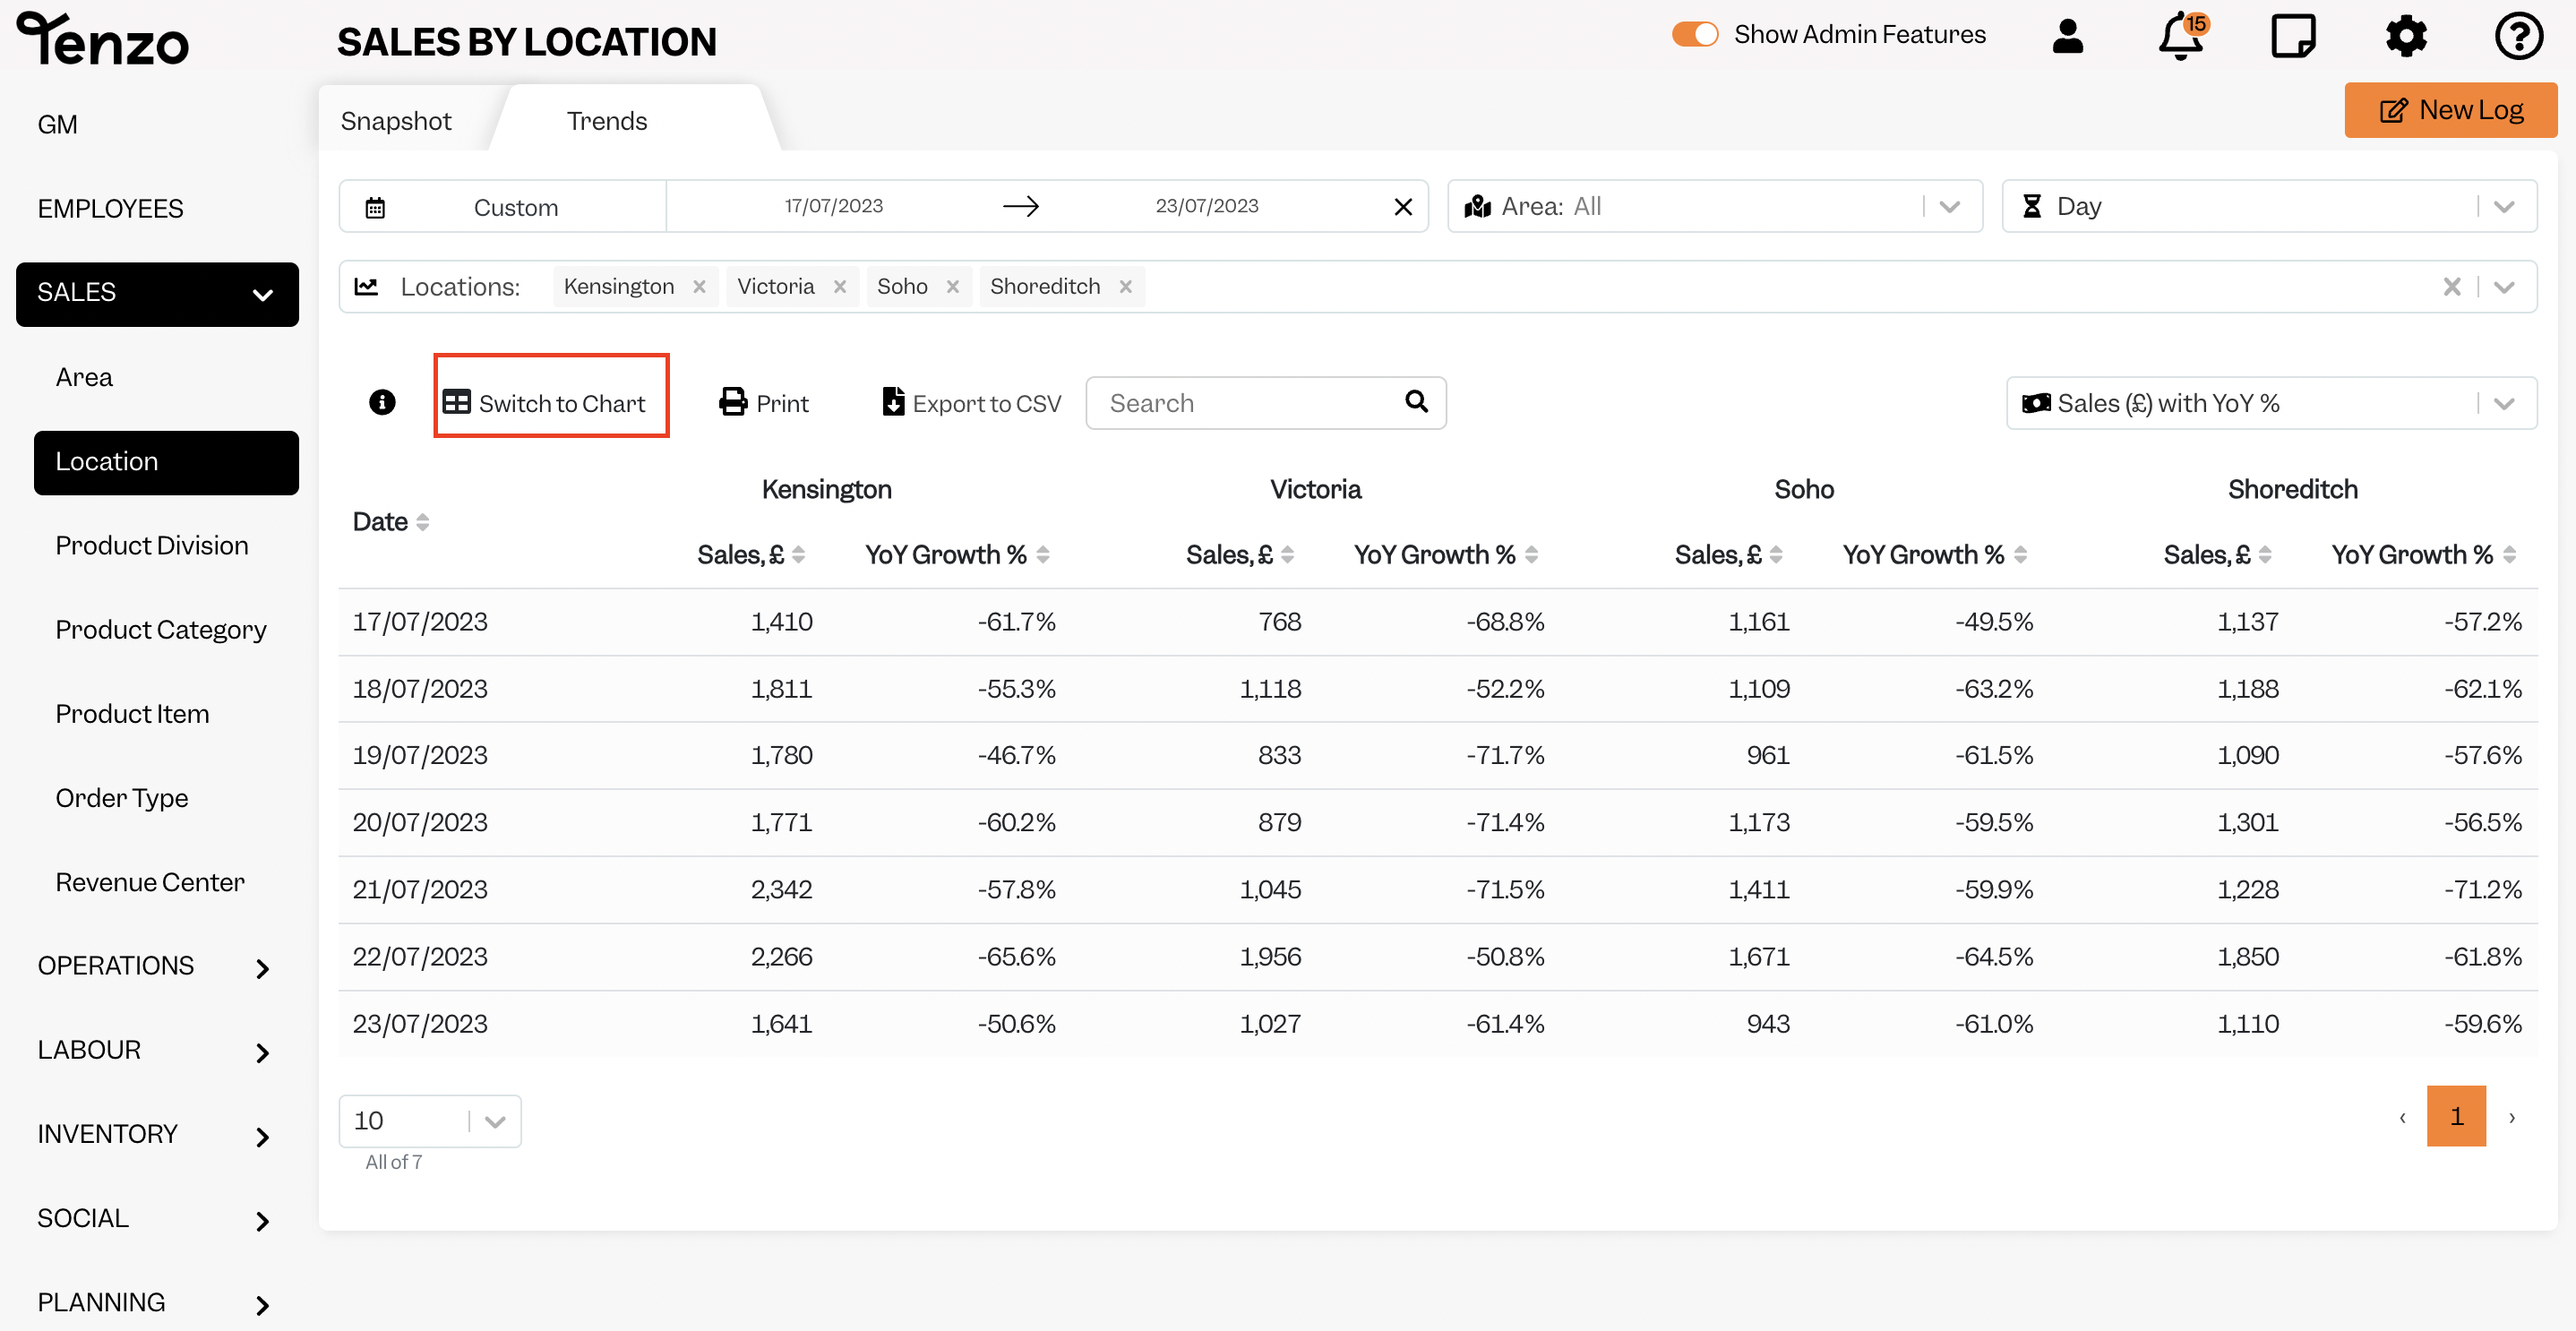
Your data can be easily exported from the table format by clicking on the Export to CSV.
How can I analyse my data? #
To analyse data by days and location in Trends, click on “Locations: Overall” and choose the Locations you want to see, or click on “Select All” to see all locations.
You can also select by Area or look at your data by day, week or month.
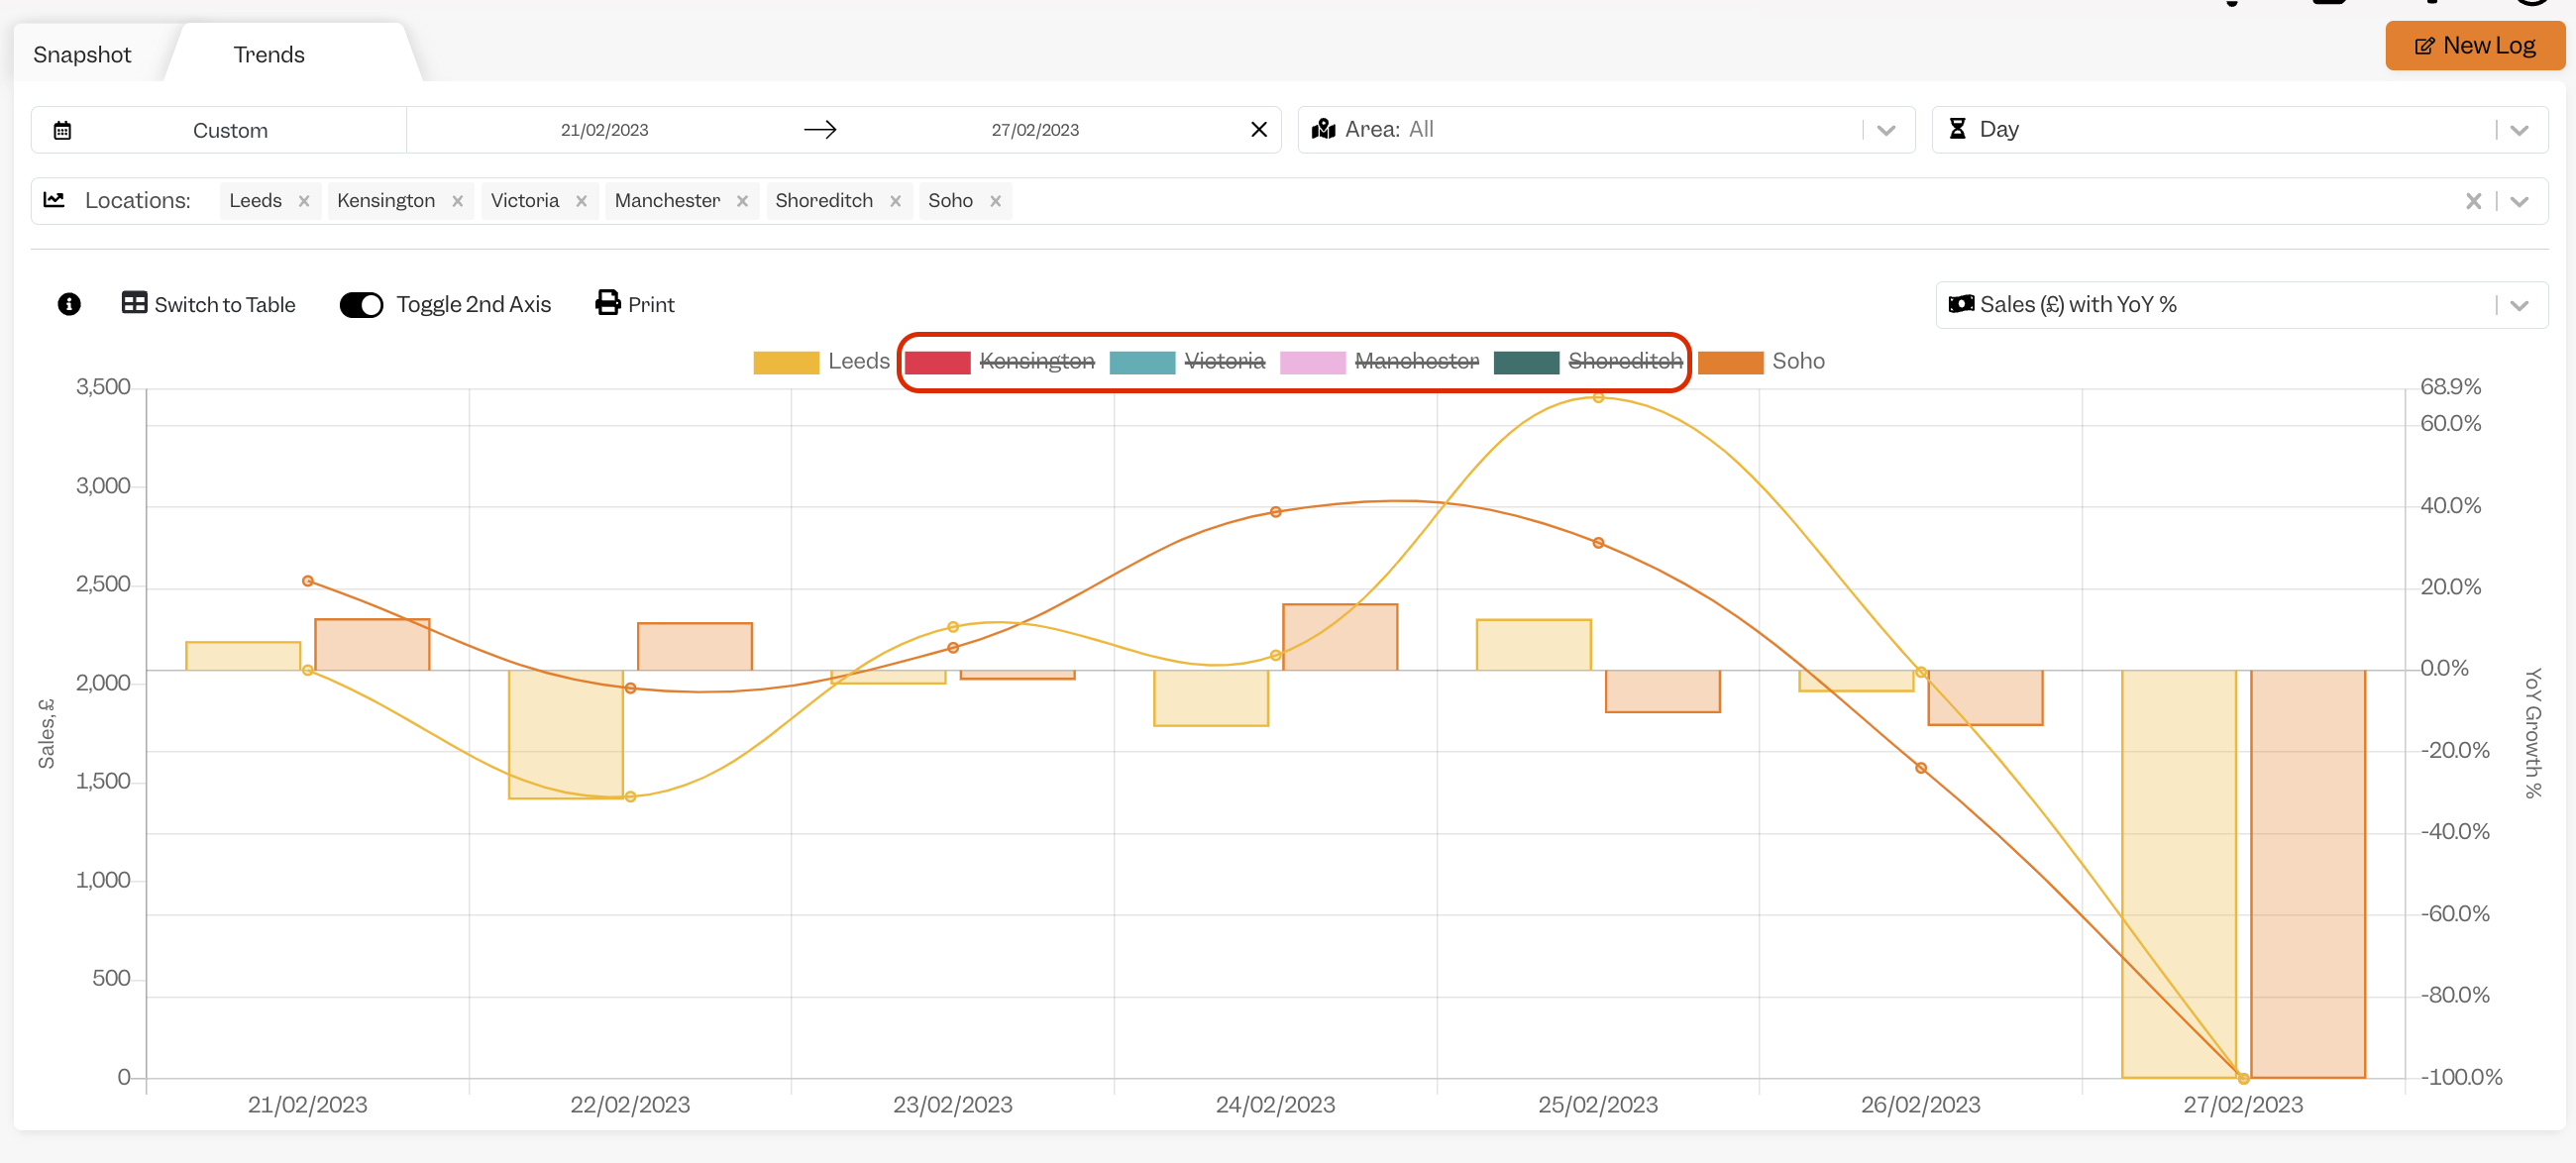
And while navigating, you can click on the location to have it unselected or selected again.
If you wonder what “Toggle 2nd Axis” means, you can visit our article here.
If you have any questions, do not hesitate to drop us an email at support@gotenzo.com.
#data #webapp #mobile


