Menu Engineering is a Tenzo dashboard that combines menu item costs with sales volume to categorise dishes into Stars, Plow horses, Puzzles and Dogs — helping you prioritise promotions, pricing and menu updates.
What is Menu Engineering & Menu Profitability? #
Menu Profitability is a method for evaluating the profit of an item purely based on ingredient costs.
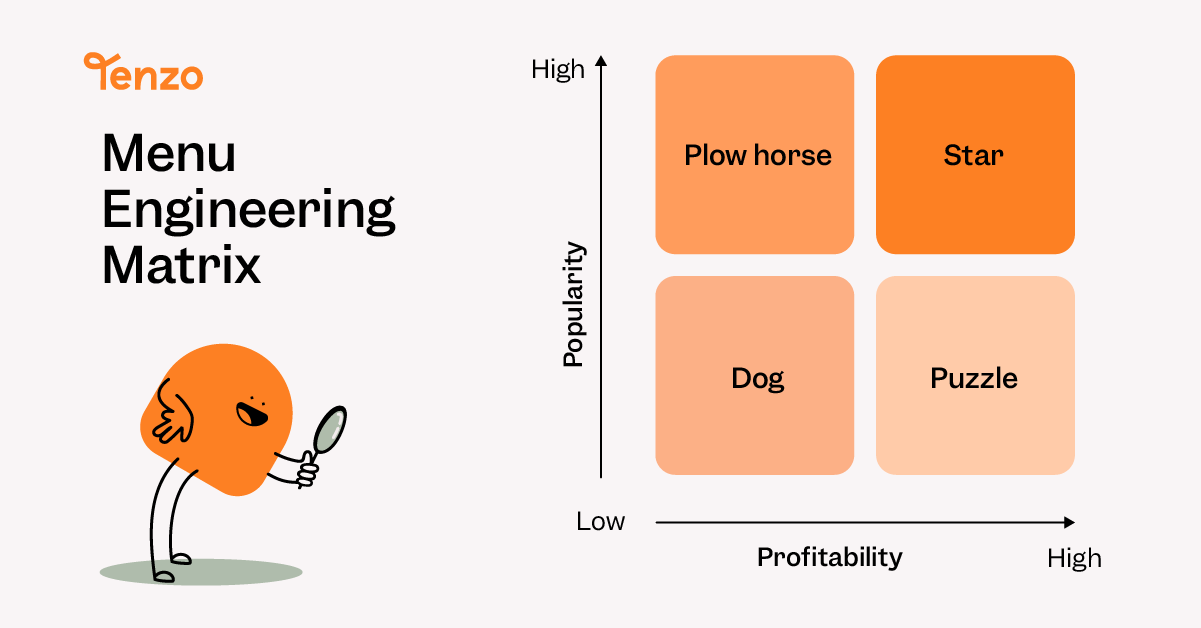
Menu Engineering compares menu popularity (quantity of items sold) with menu profitability (price sold for minus ingredient cost) to place each dish into one of four cells:
-
⭐ Stars — High profit, high popularity → promote and protect supply.
-
🐎 Plow horses — Low profit, high popularity → reduce cost/portion, or upsell.
-
🧩 Puzzles — High profit, low popularity → re-market, train staff, reposition.
-
🐶 Dogs — Low profit, low popularity → rework, replace, or remove.
By seeing which items falls into which category these groups allow you to make targeted decisions about your menu.
Why This Matters #
Assuming you have the required integrations (see below), then you already have this data! Menu Engineering combines data from POS sales and inventory costs — into operational actions that can help improve margin and revenue.
How Tenzo Builds the Menu Engineering Dashboard #
Tenzo combines:
-
Menu item cost (unit_cost in Card Creator) — from your inventory data.
-
Sales revenue & quantities (sales and quantity in Card Creator) — from your POS data.
-
Calculated columns in Tenzo’s Card Creator then combine these two to generate a profit per item. This is calculated as such:
-
Profit margin per item = Price − Cost (Sales – unit_cost).
-
Profit per item = profit margin per item × quantity sold.
-
Recommended View in Card Creator: 286 — Inventory Menu Item Cost with Sales (with Modifiers). This view includes modifier impact and is the main view for accurate menu-level profit calculations.
What Cards are on the Menu Engineering Dashboard?
💰 Gross profit summary
#
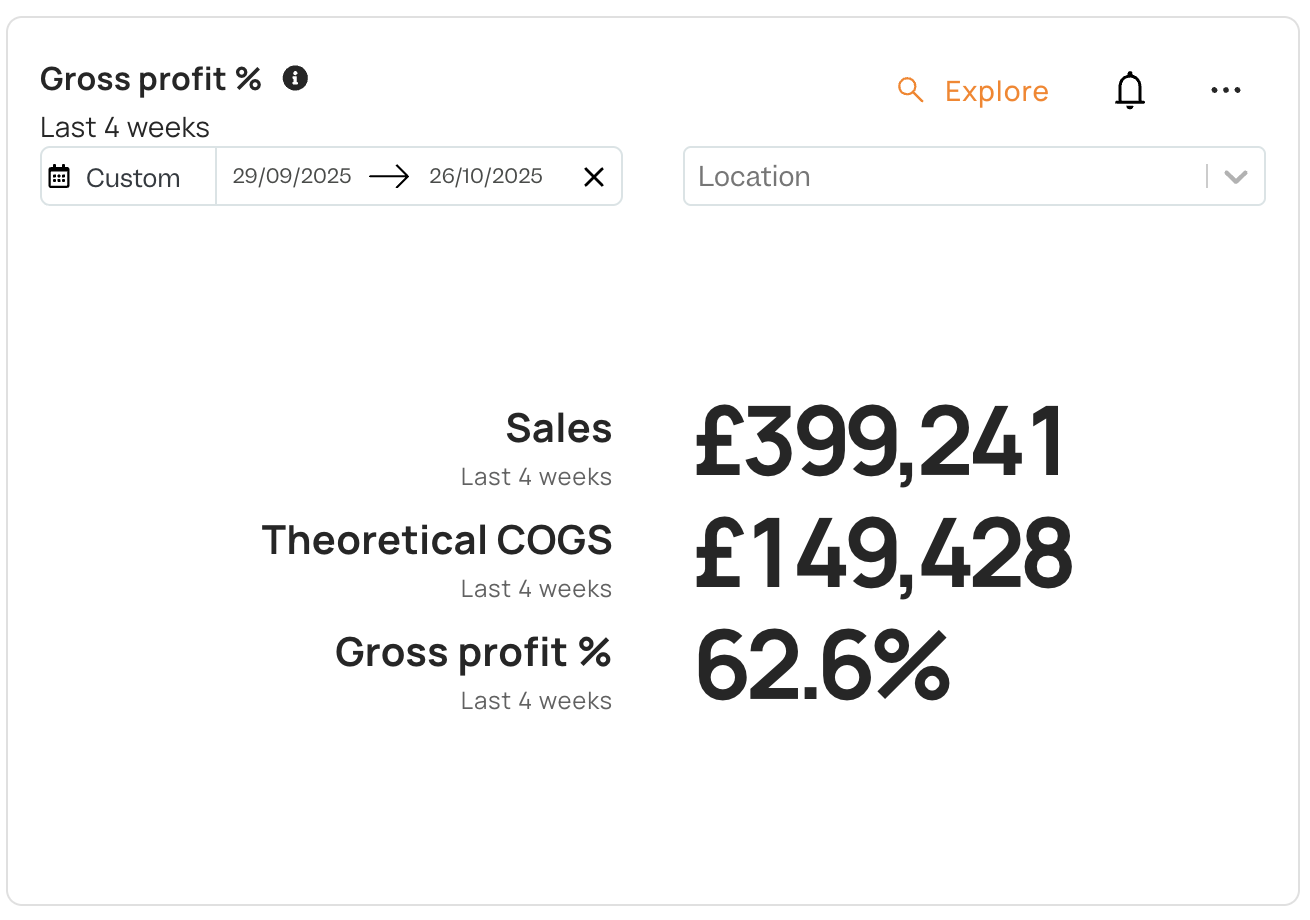
This card gives you a quick at-a-glance snapshot of how your menu is performing overall for the selected date range.
It displays:
-
Sales (£) – Total sales generated across all menu items.
-
Theoretical COGS (£) – Total cost of goods based on recipe/inventory costs.
-
Gross profit % – Your overall GP% across all items (calculated as
(Sales - Cost) ÷ Sales).
How to use it:
-
Use this card as a performance health check — it tells you whether your menu is operating at a healthy margin.
-
Track this weekly and compare against your target GP% (most restaurants aim for 65-75% depending on service type).
-
If Gross profit % has dropped, click into Menu profitability or Menu engineering matrix to identify which items caused it.
🍽 Gross profit contribution (by Category or Division or Item)
#
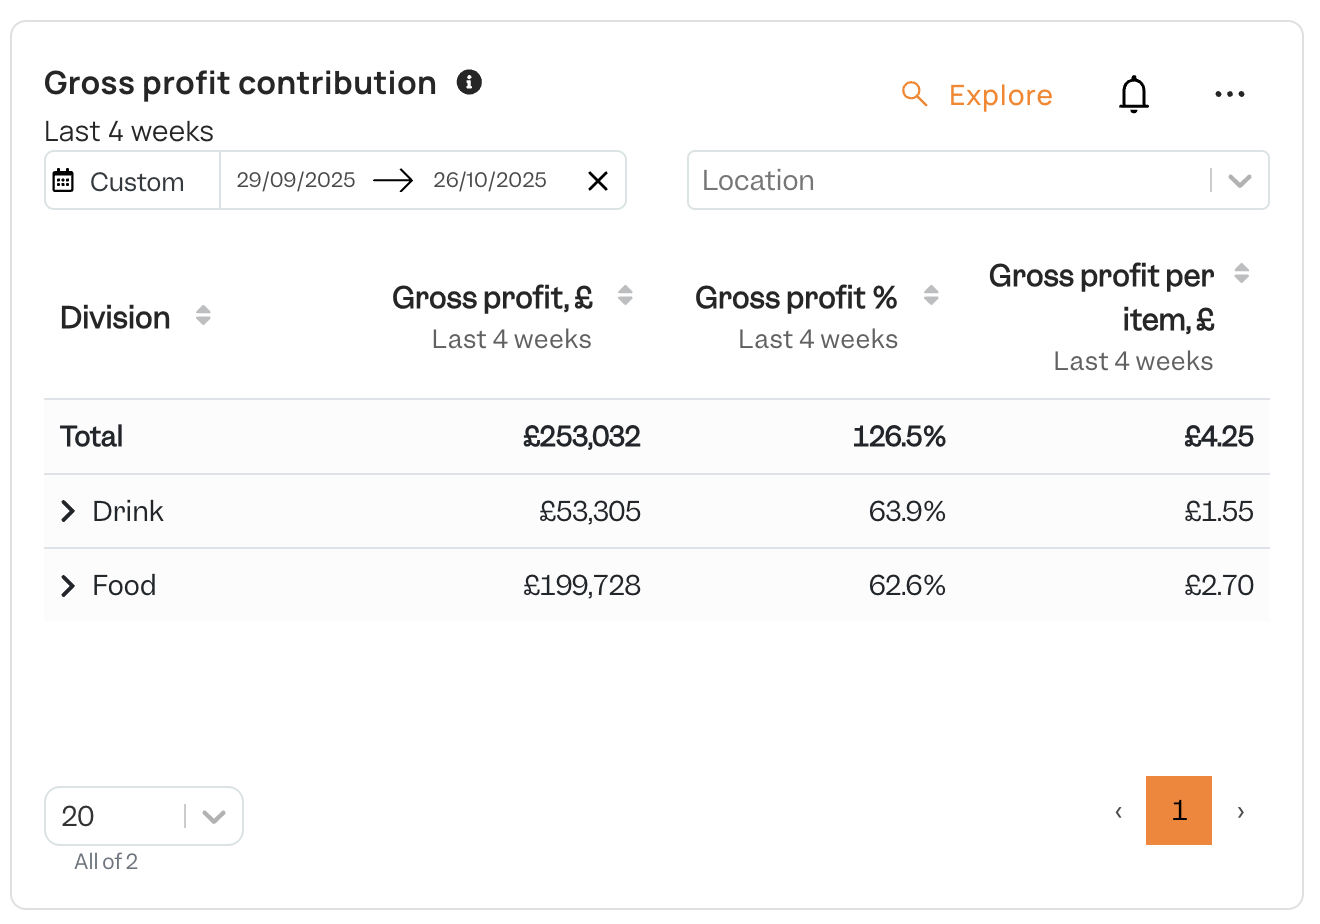
This card breaks down where your profit is actually coming from — helping you see whether Food vs Drink (or any division/category) is pulling its weight.
Each row shows:
-
Gross profit (£) – Total profit generated by that division/category.
-
Gross profit (%) – Profit margin for that division — useful for spotting underperforming segments.
-
Gross profit per item (£) – Average profit per sale — great for spotting high-value or low-value contributors.
How to use it:
-
Quickly see whether Drink or Food contributes more to total gross profit — great for pricing and promotional strategy.
-
If a division has high revenue but low GP%, it may be popular but not profitable — similar to a Plow horse in the matrix.
-
Use this to prioritise operational focus — e.g. if Food contributes 80% of margin, menu updates there will have the biggest impact.
🥇 Top sellers & margins #
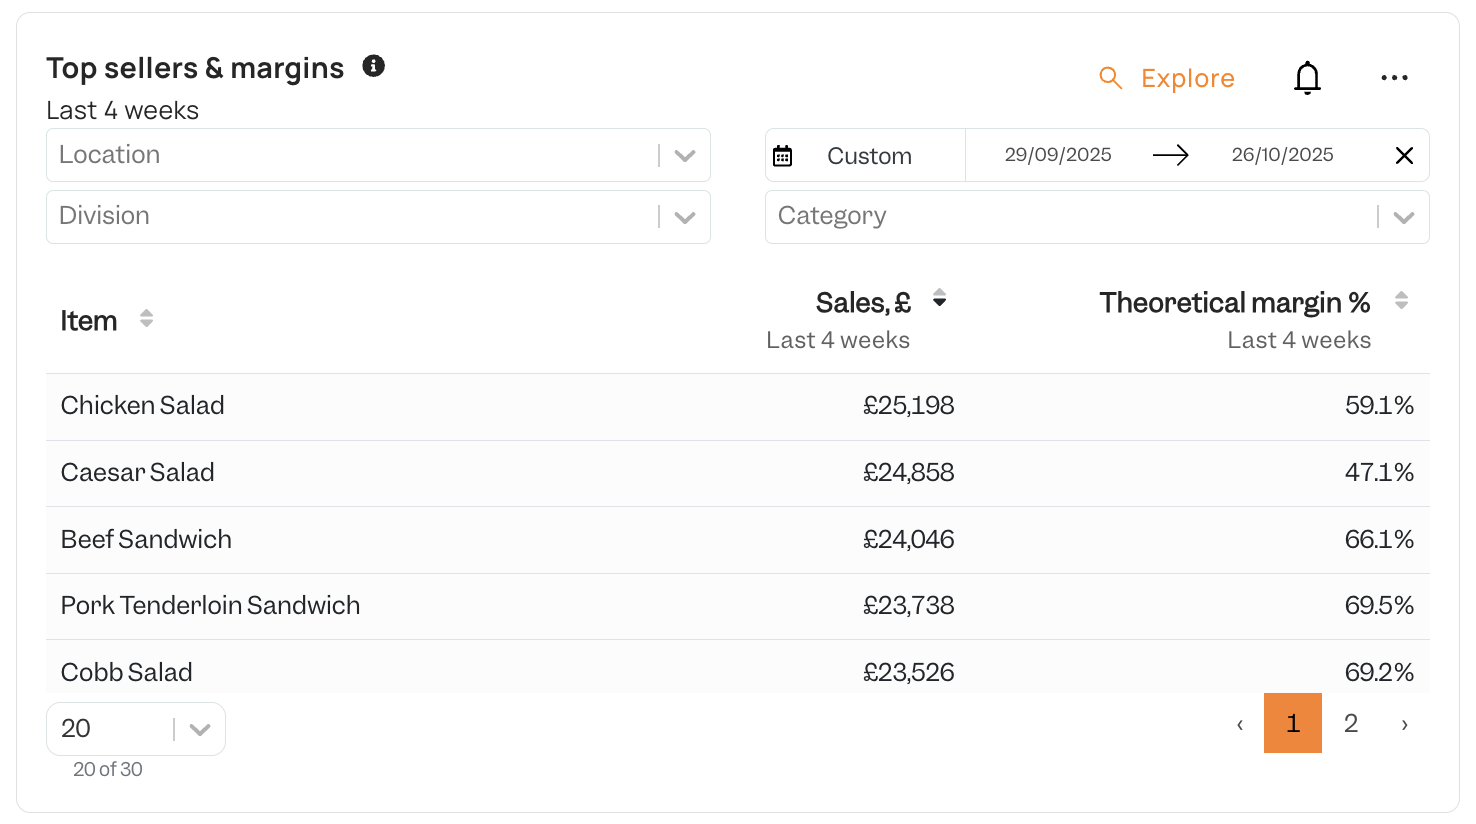
This card highlights your best-selling items and their theoretical profit margins over the selected period. It helps you quickly identify which menu items are driving the most revenue — and whether their profitability matches their popularity.
Each row represents a menu item, showing:
-
Sales (£) – Total sales of each menu item during the selected period.
-
Theoretical margin (%) – Expected gross profit percentage based on recipe costs.
How to use it:
-
Identify top-selling items that combine strong sales and healthy margins — these are your key revenue and profit drivers.
-
Spot high-volume but low-margin items — candidates for price review, recipe adjustment, or supplier negotiation.
-
Filter by Category, Location, or Division to see where performance varies across sites or menu types.
-
Compare this card with the Menu profitability or Item price trend cards to validate whether theoretical margins align with actual performance and ingredient costs.
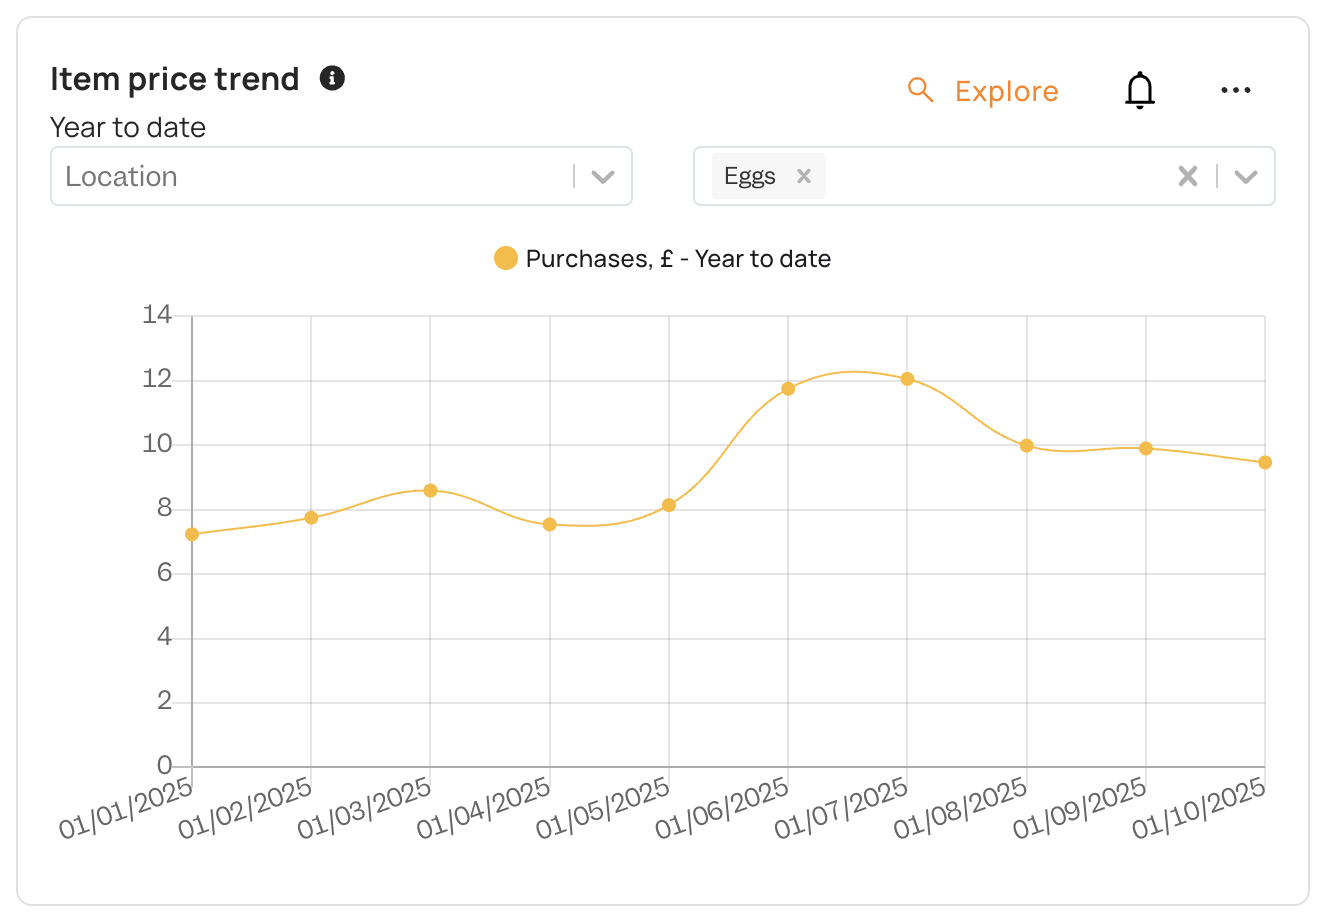
📈 Item price trend (Purchases £ – Year to Date) #
This card tracks how the cost of ingredients for a specific item has changed over time.
-
It visualises purchase costs (£) for a selected item, plotted month by month (year-to-date).
-
Rising trends can indicate supplier price increases, changes in portion size, or seasonal fluctuations — all of which directly affect profitability.
How to use it:
-
If costs are trending upwards, consider renegotiating supplier contracts, adjusting menu pricing, or modifying recipes to maintain profitability.
-
Combine this insight with the Categories GP card: if an item’s GP% is falling and ingredient costs are rising, it’s a strong signal to act.
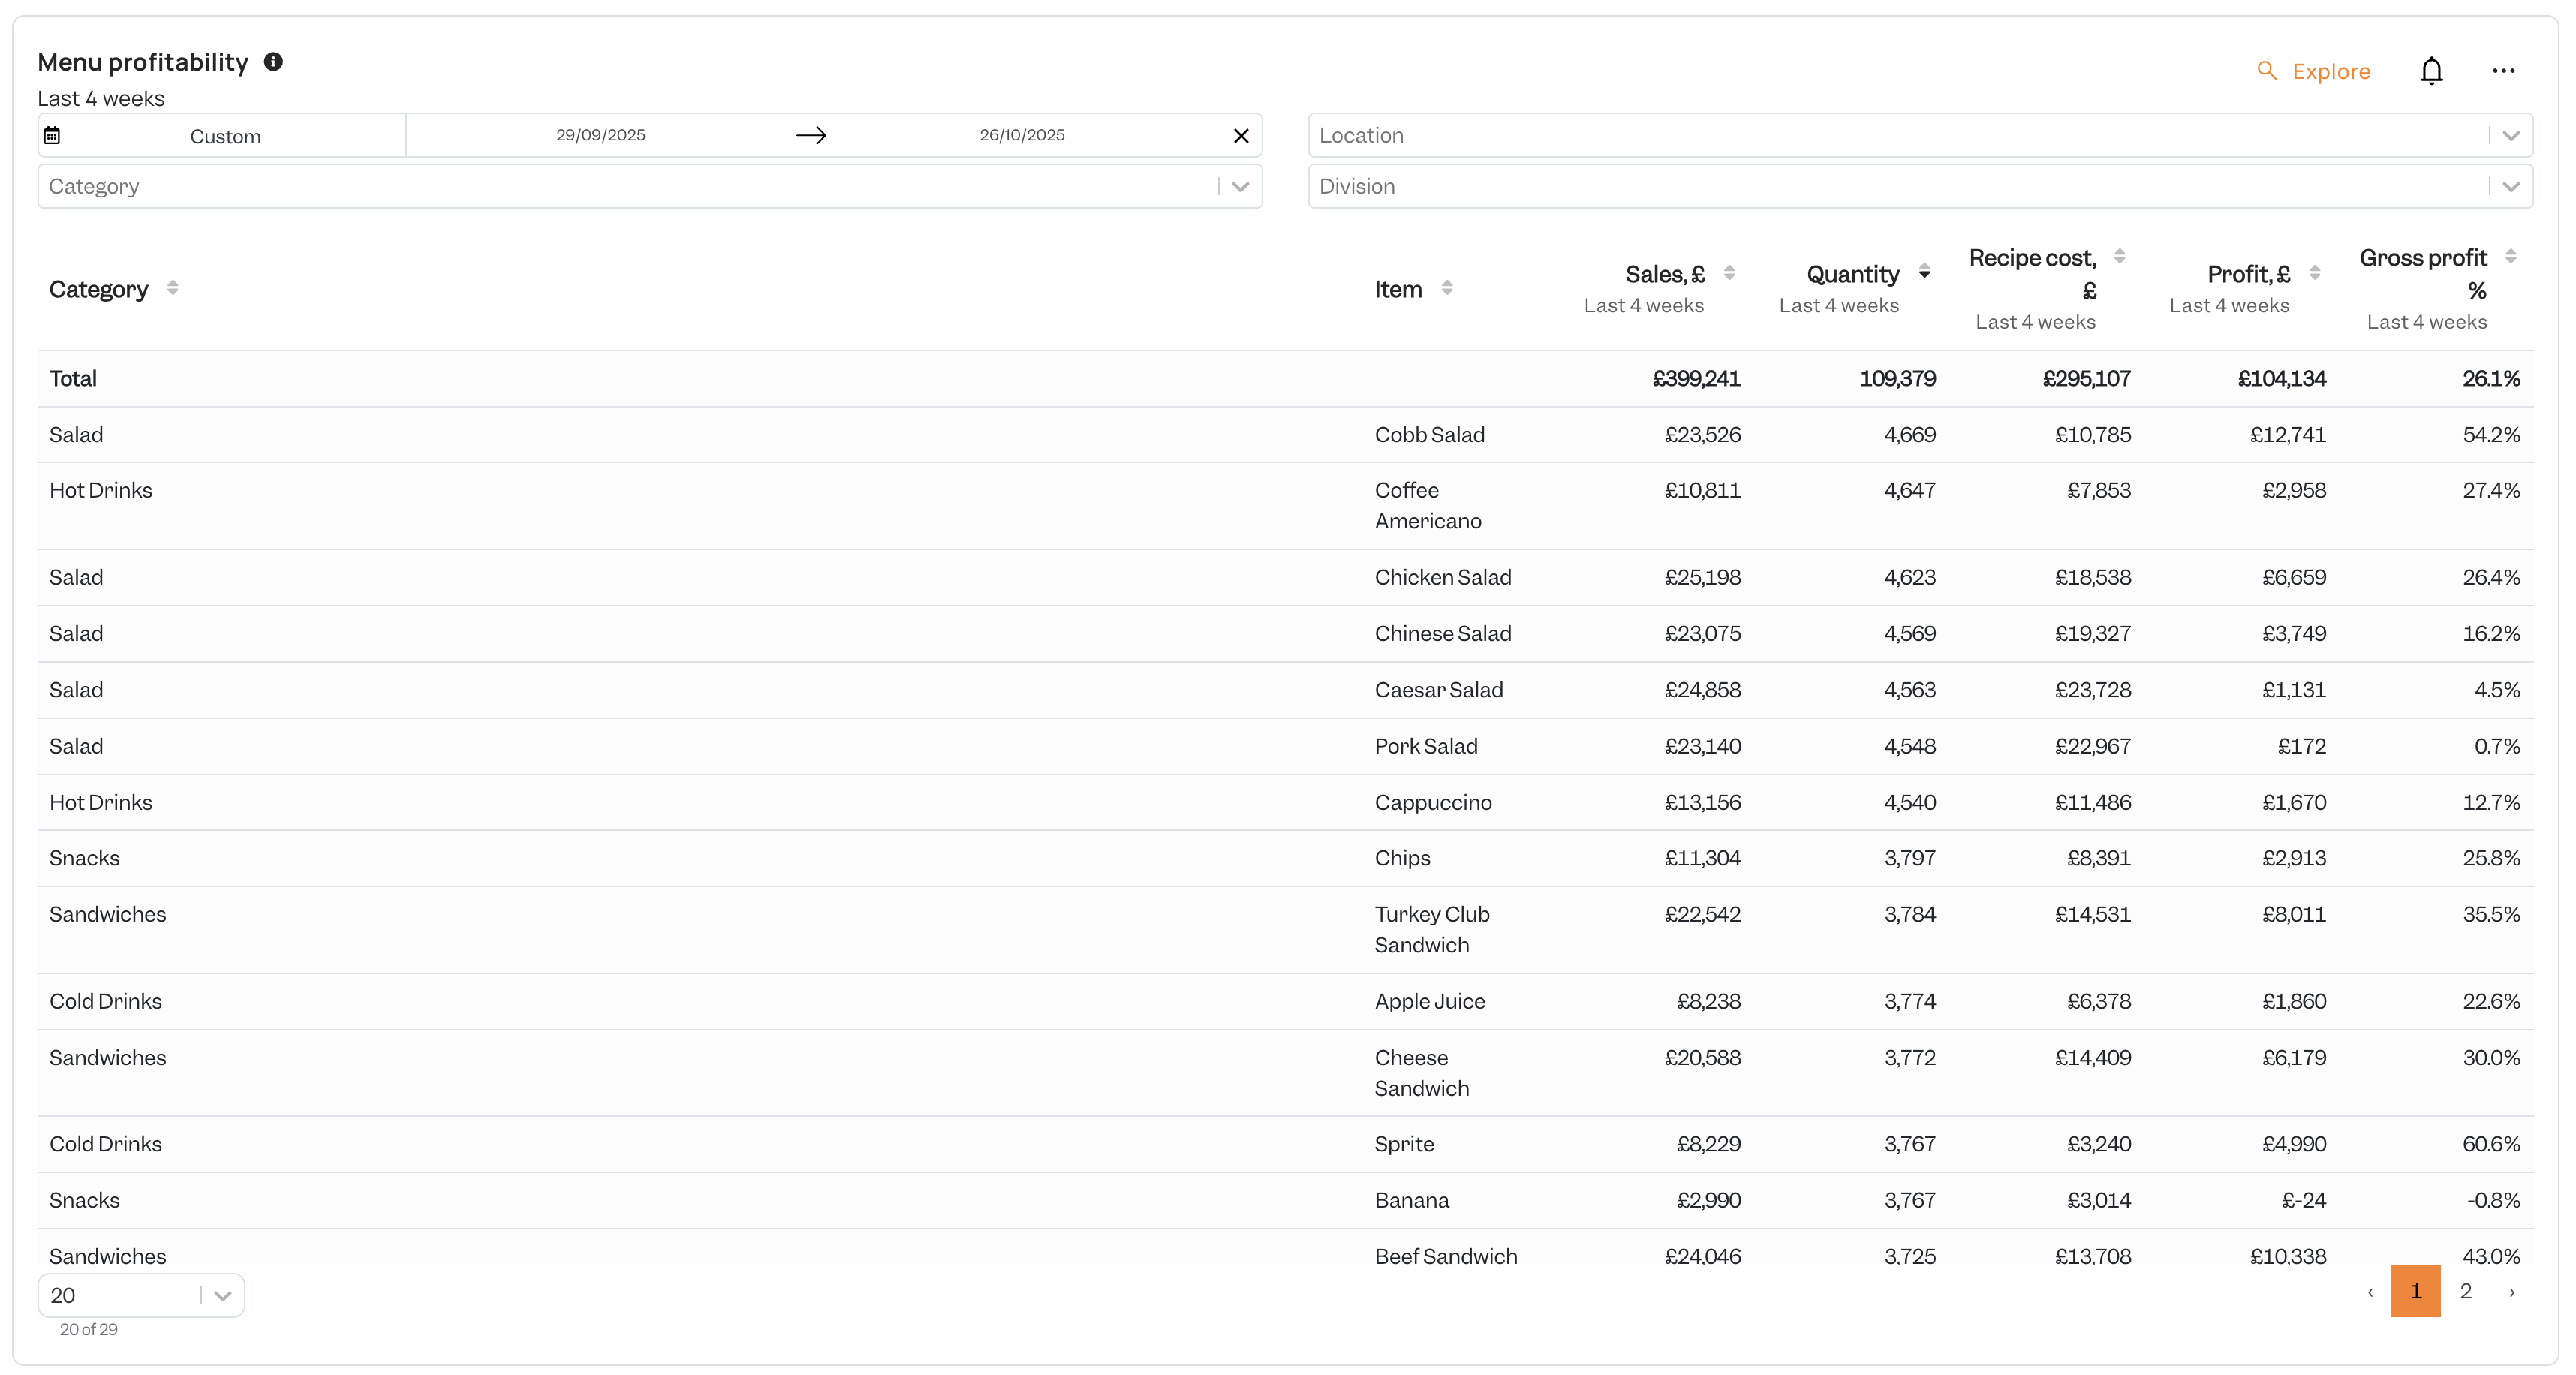
💸 Menu profitability (Detailed item breakdown) #
This card gives a granular, week-by-week view of profit performance at the item level. Where the Matrix card focuses on strategic decisions, this one dives into the numbers behind the strategy.
Each row represents a menu item, showing:
-
Sales (£) – Total sales of each menu item.
-
Quantity sold: Total units sold during the selected period.
-
Recipe cost (£): Total cost of ingredients used to make those units.
-
Profit (£): Total profit generated by that item (Sales revenue − Recipe cost).
-
Gross profit %: Gross profit margin percentage for that item.
How to use it:
-
Identify high-volume, high-profit items — these are your core revenue drivers.
-
Spot low-margin or low-profit items that might be dragging down overall performance.
-
Filter by Category to benchmark similar items against each other (e.g. all salads or all cold drinks).
-
Combine with the Menu engineering matrix to validate decisions: if an item is a Plow horse in the matrix and shows low GP% here, cost optimisation is likely the right move.
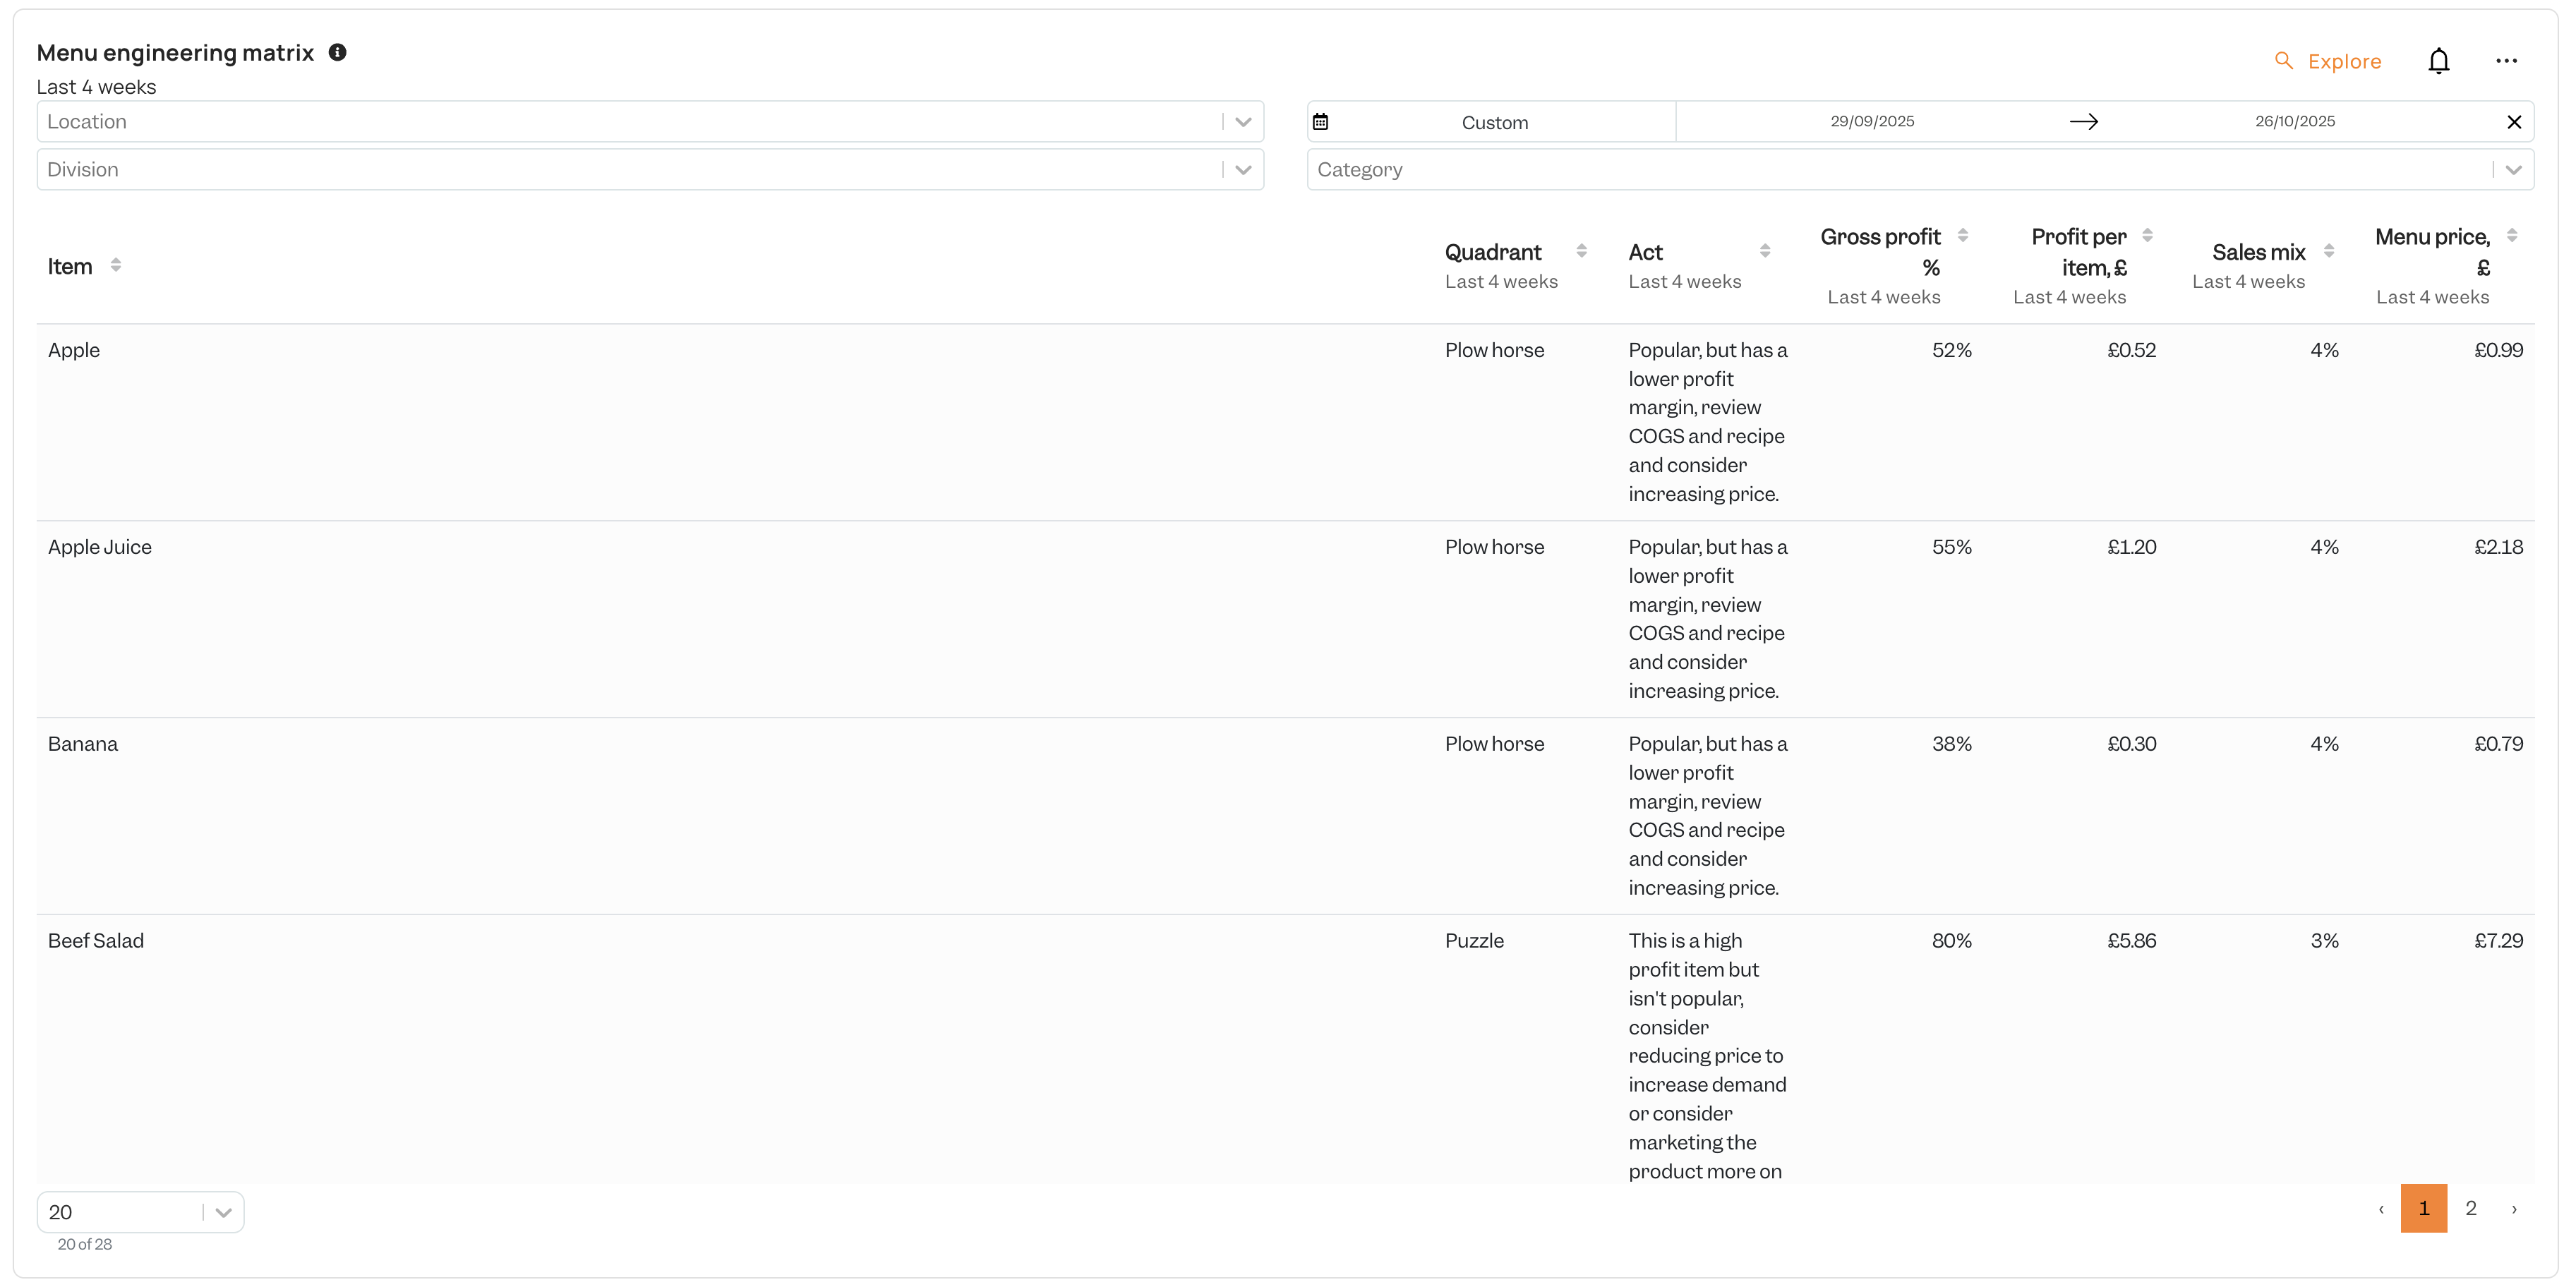
🪄 Menu engineering matrix (Quadrant view) #
This card is the heart of the Menu Engineering dashboard. It categorises every item into one of the four classic menu engineering quadrants — ⭐ Star, 🐎 Plow horse, 🧩 Puzzle, 🐶 Dog — based on their profitability and popularity.
-
Quadrant: Shows where each item sits in the matrix (e.g. Star, Plow horse).
-
Act: Practical recommendations tailored to each item’s performance (e.g. “Popular but low profit — review recipe and consider price increase”).
-
Gross profit (%): The profit margin for the item based on sales price and cost.
-
Profit per item (£): How much profit each sale generates in absolute terms.
-
Sales mix (%): The percentage of total sales the item represents — a measure of popularity.
-
Menu price (£): The current sale price.
How to use it:
-
Stars: High profit and high popularity — keep them prominent on the menu and consider slight price increases.
-
Plow horses: Popular but less profitable — look for cost optimisations, portion adjustments, or upsells.
-
Puzzles: Profitable but low sales — try renaming, repositioning, or promoting them.
-
Dogs: Low profit and low sales — consider removing or reworking these items.
Creating Your Own Menu Engineering Cards #
If you think there is anything missing, then you can build custom cards or tweak existing ones using Card Creator. Please see this page or contact your CSM for more information.
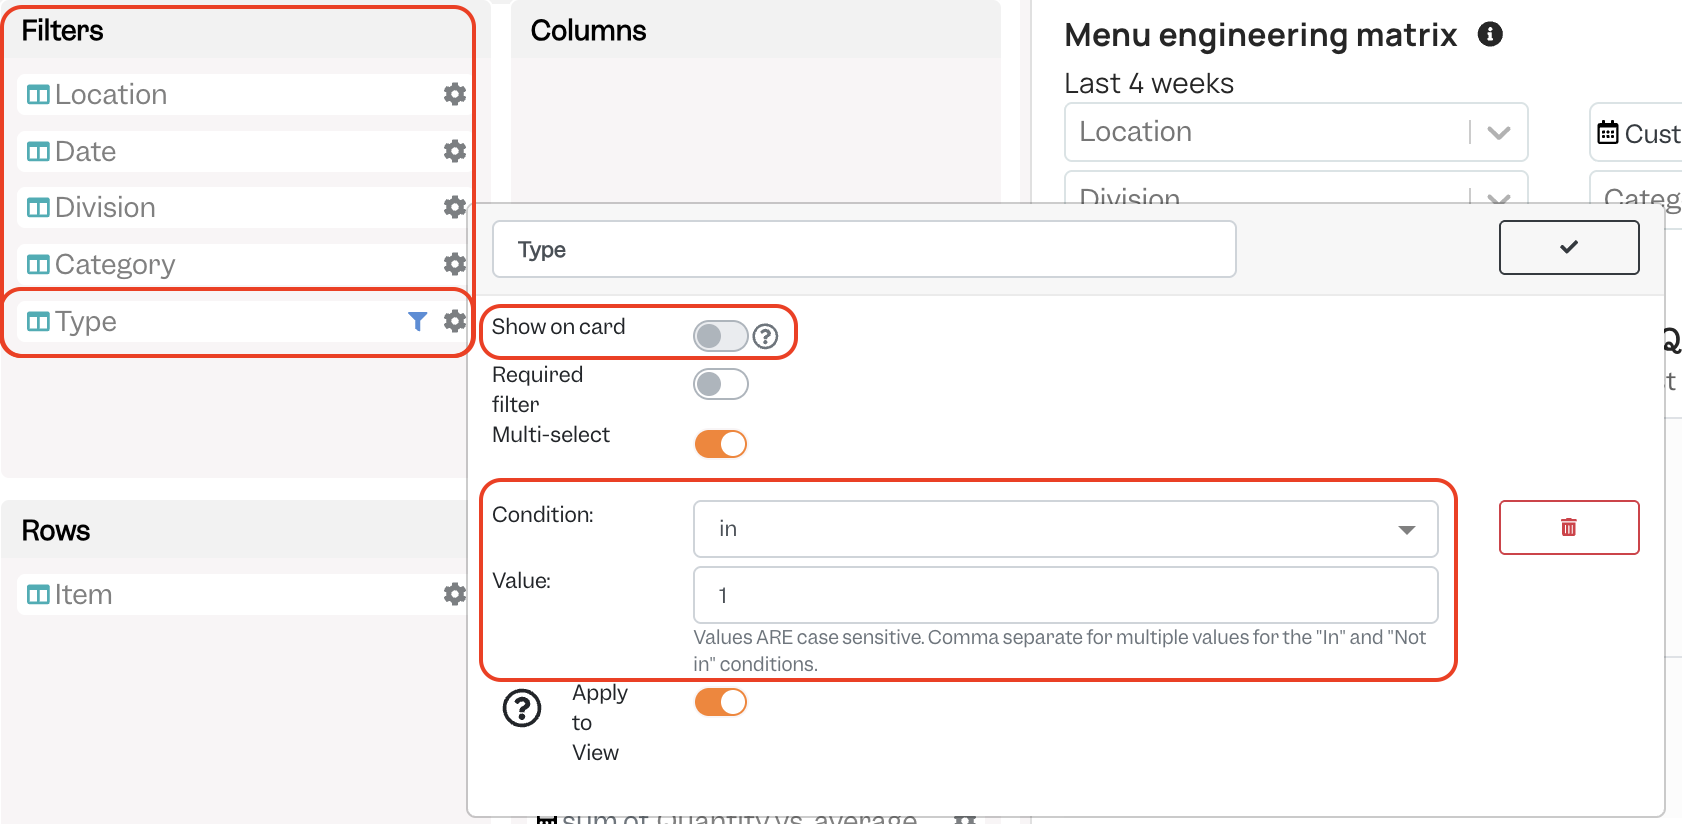
Note: If you are creating your own cards in Card Creator relating to Menu Engineering using View 286, please note that this view contains items and modifiers combined under the ‘Item’ metric. This is so that all food and drink is covered in profitability calculations. However if you would like to not see modifiers and only show items, this can be done by:
-
Adding the ‘Type’ dimension to the ‘Filters’ box.
-
Click the cog wheel icon then ‘Add default filter’.
-
Choose Condition: in and Value: 1. The ‘1’ here corresponds to items, so we’re saying only include items. Modifiers are value 4.
-
Un-toggle ‘Show on card’.
Supported Integrations #
These integrations currently support Menu Engineering:
If your inventory system is not listed, contact your CSM to discuss options.
How Do I Get the Menu Engineering Dashboard? #
Please ask your CSM to add the Menu Engineering dashboard to your account.
It can be configured, using your user groups, to only be visible to certain groups that you choose(e.g. Administrators).
Examples of Actions #
The following are some example actions that could be taken based on where menu items appear in the Menu Engineering matrix:
-
⭐ Stars: Put item on the menu hero position; add to staff suggestion prompts; keep stock levels high.
-
🐎 Plow horses: Reduce portion size slightly; negotiate supplier cost; offer premium add-ons.
-
🧩 Puzzles: Run a featured weekly special; test a slightly lower price; staff upsell script.
-
🐶 Dogs: Remove, replace with a variant, or rework recipe to improve margin.
Known Limitations & Notes #
-
Data accuracy depends on correct recipe costs and correct POS codes on menu items in your inventory tool.
-
If modifiers are not tracked in your POS, please be aware totals may understate costs as modifiers will not be included.
-
For very low sales-volume items (e.g., sold <5 times in the date range), treat their quadrant as noisy; use testing or extended date ranges before taking any action on the menu item.
-
Service Charge is not included in any of the cards on this dashboard.


