
- Rank every site on variance and wastage together
- Dig into the outlier site
- Zoom in to find the exact items
- Compare that one item back across every site
- What is AvT (actual versus theoretical) in restaurant inventory?
- How do you tell the difference between food waste and theft in a restaurant?
- What is an acceptable food cost variance for a restaurant?
- How do you find out which site is losing stock?
- What data do you need to run an inventory variance analysis?
Most stock reports tell you that variance exists. This recipe tells you where it is, what is causing it and which site to have the conversation with — by drilling from site to category to item, then comparing that one item back across every site. One five-site group, one quarter: £88k of actual-versus-theoretical variance and £95k of recorded wastage, with 73% of the variance sitting in a single site.
The group behind these numbers runs Toast for point of sale and MarketMan for inventory. Figures and site names have been anonymised.
Eight pages, worked end to end on real sanitised numbers: ranking every site on AvT and wastage, breaking the worst site down by category, telling over-ordering apart from recipe drift, drilling to item level, then comparing one item across all sites.

Rank every site on variance and wastage together #
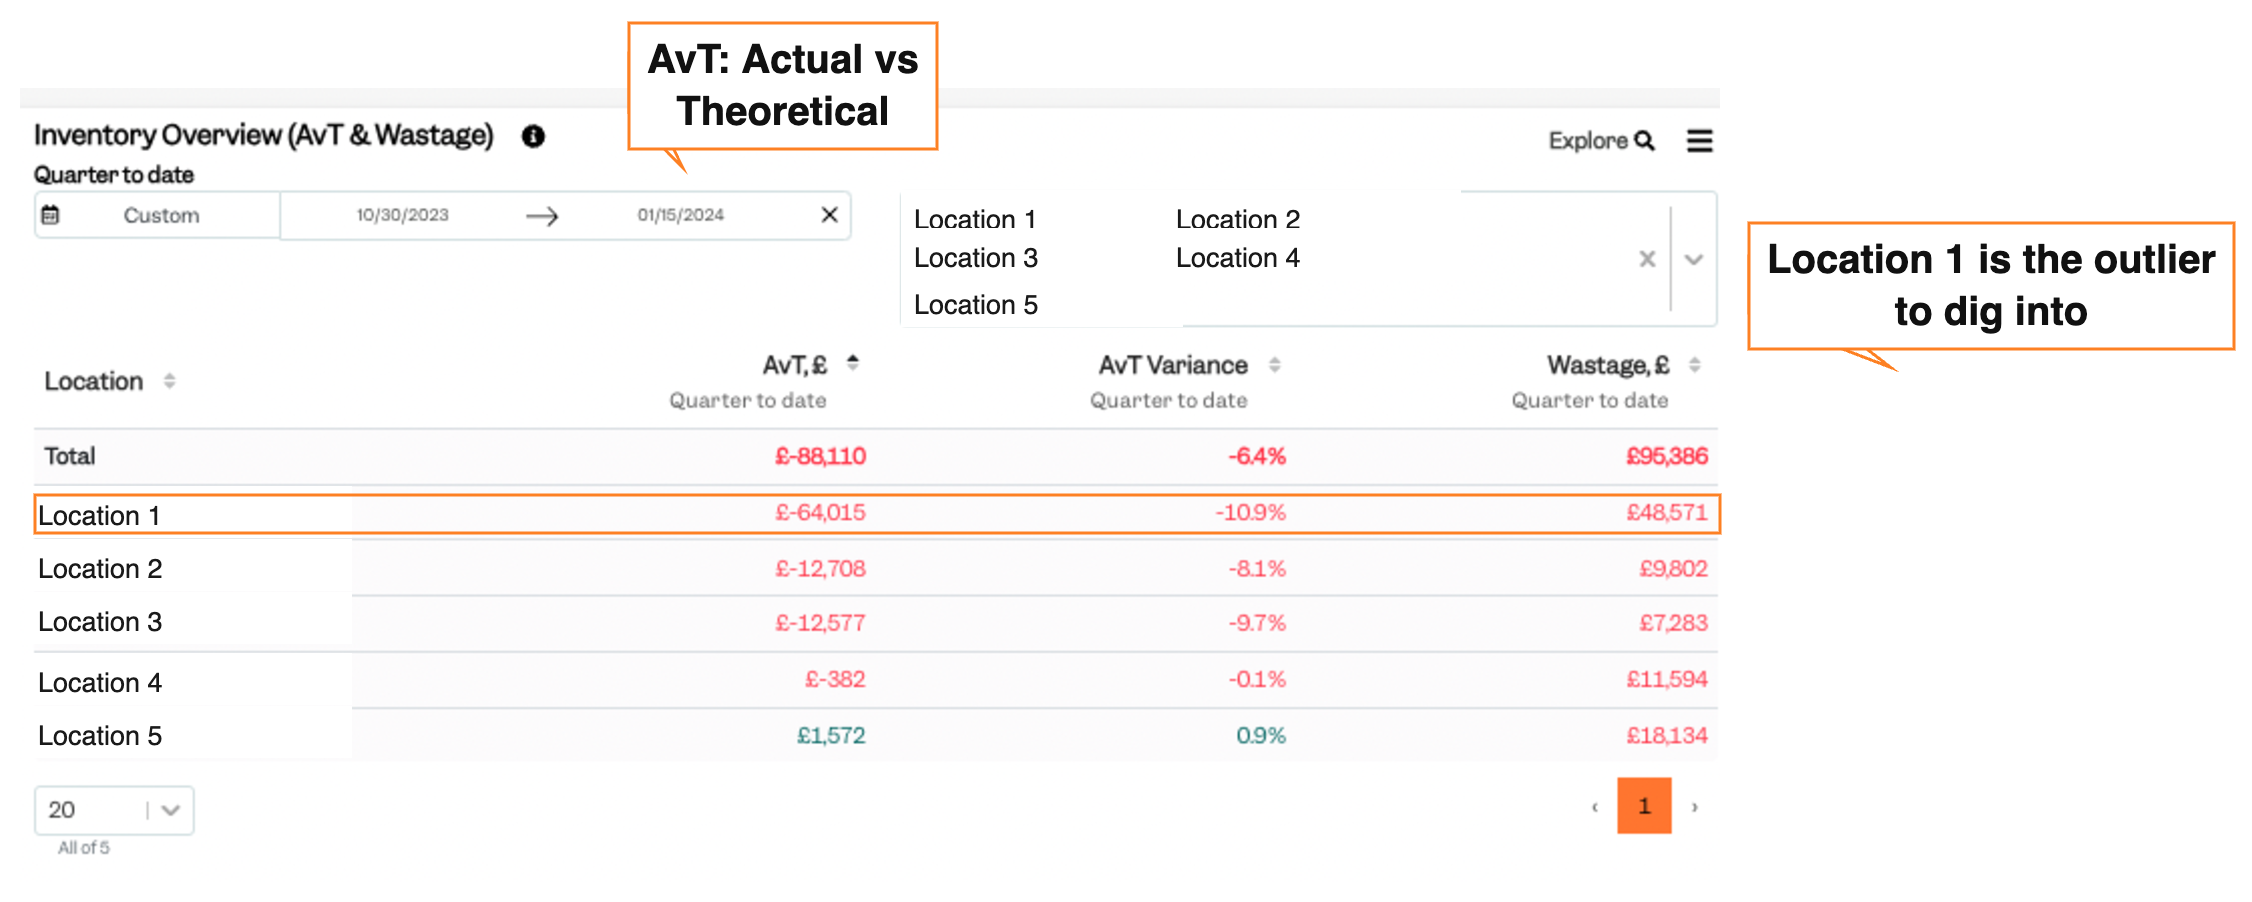
Start with one table: actual-versus-theoretical variance and recorded wastage side by side, every site, one period. In this group £88,110 of AvT variance and £95,386 of wastage sat across five sites in a single quarter — and one site carried 73% of the variance and half the wastage. Note the two sites at the bottom running roughly flat, because they are the internal benchmark for everything that follows. Read AvT and wastage together. A site can look clean on one and be the worst in the group on the other.
Dig into the outlier site #
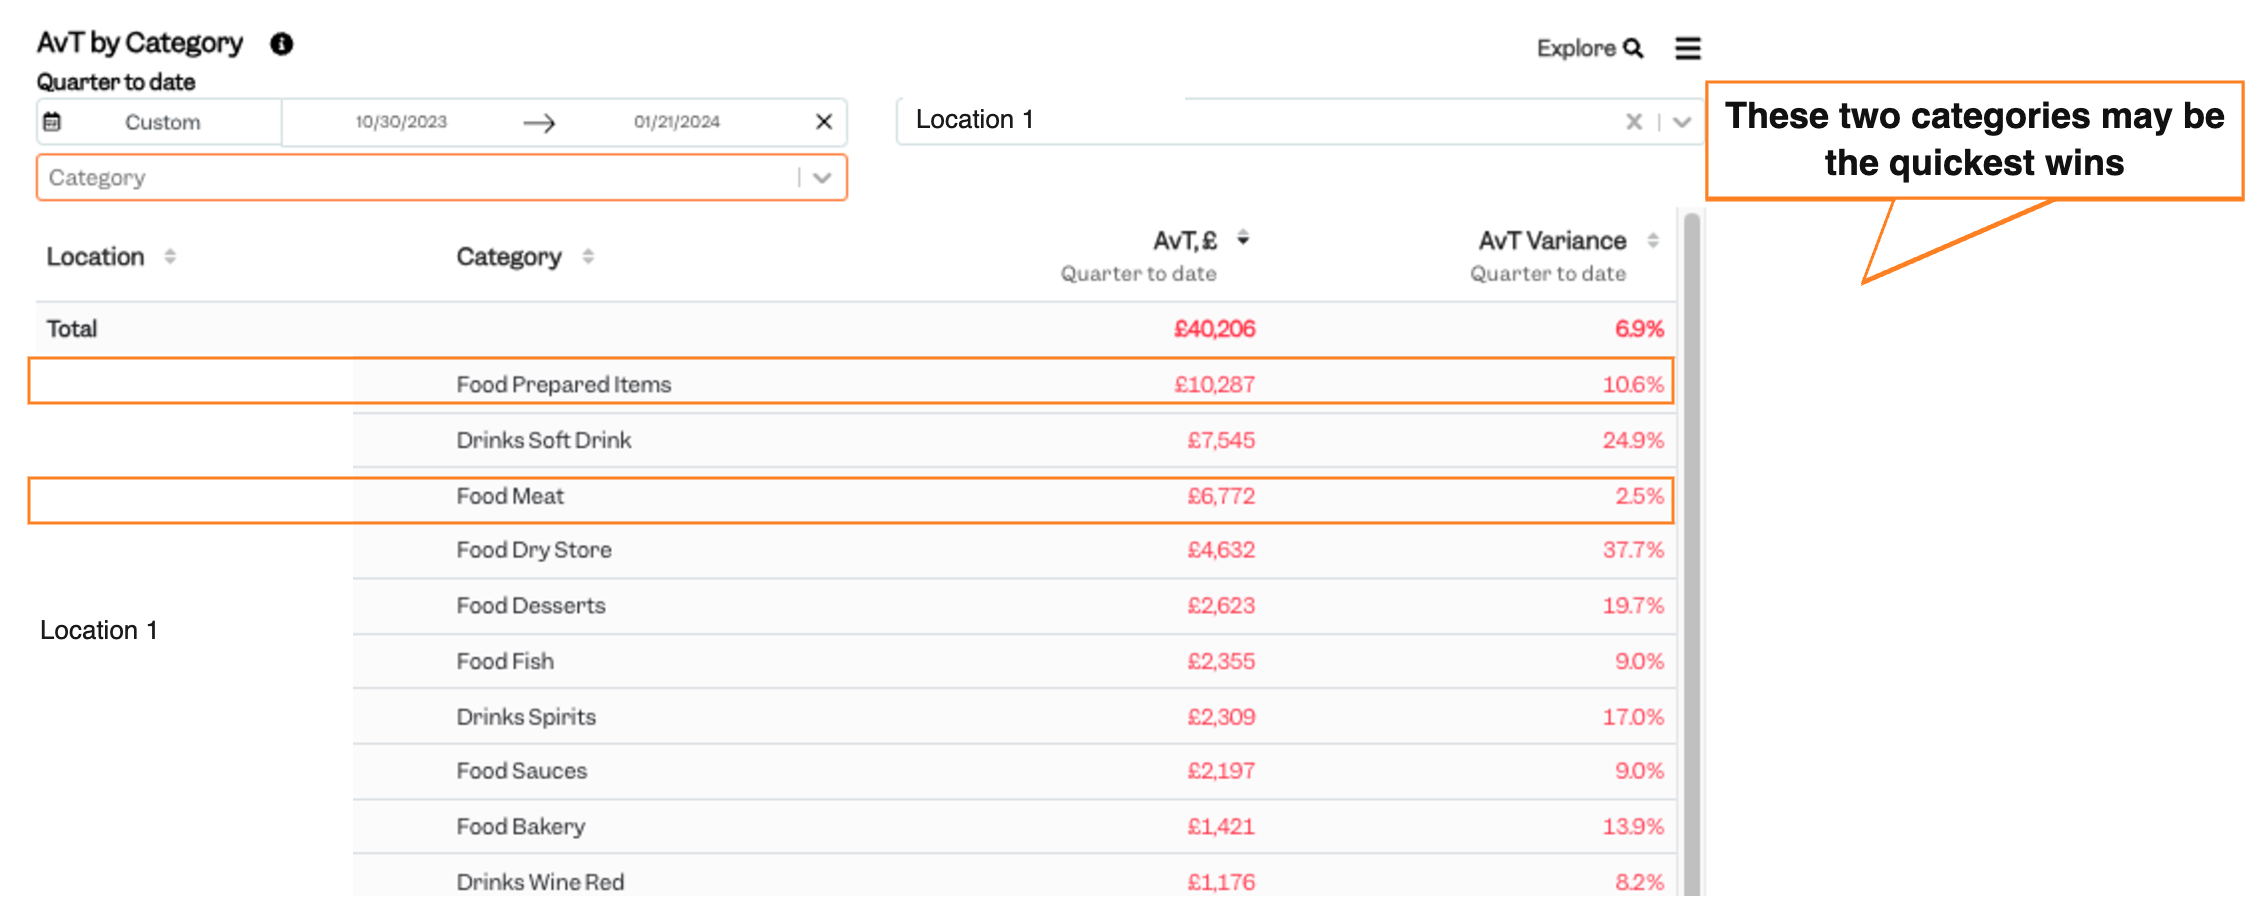
Now take that one site and break its variance out by category, so you can see which parts of the kitchen the money is going missing in. Food Prepared Items came out top at £10,287, and Food Meat sat third at £6,772. Soft drinks looked bad at 24.9%, but that is staff drinks — a known cost, not a problem to solve. The biggest percentage is rarely the biggest problem. Skip the categories you already know the answer to.
Zoom in to find the exact items #
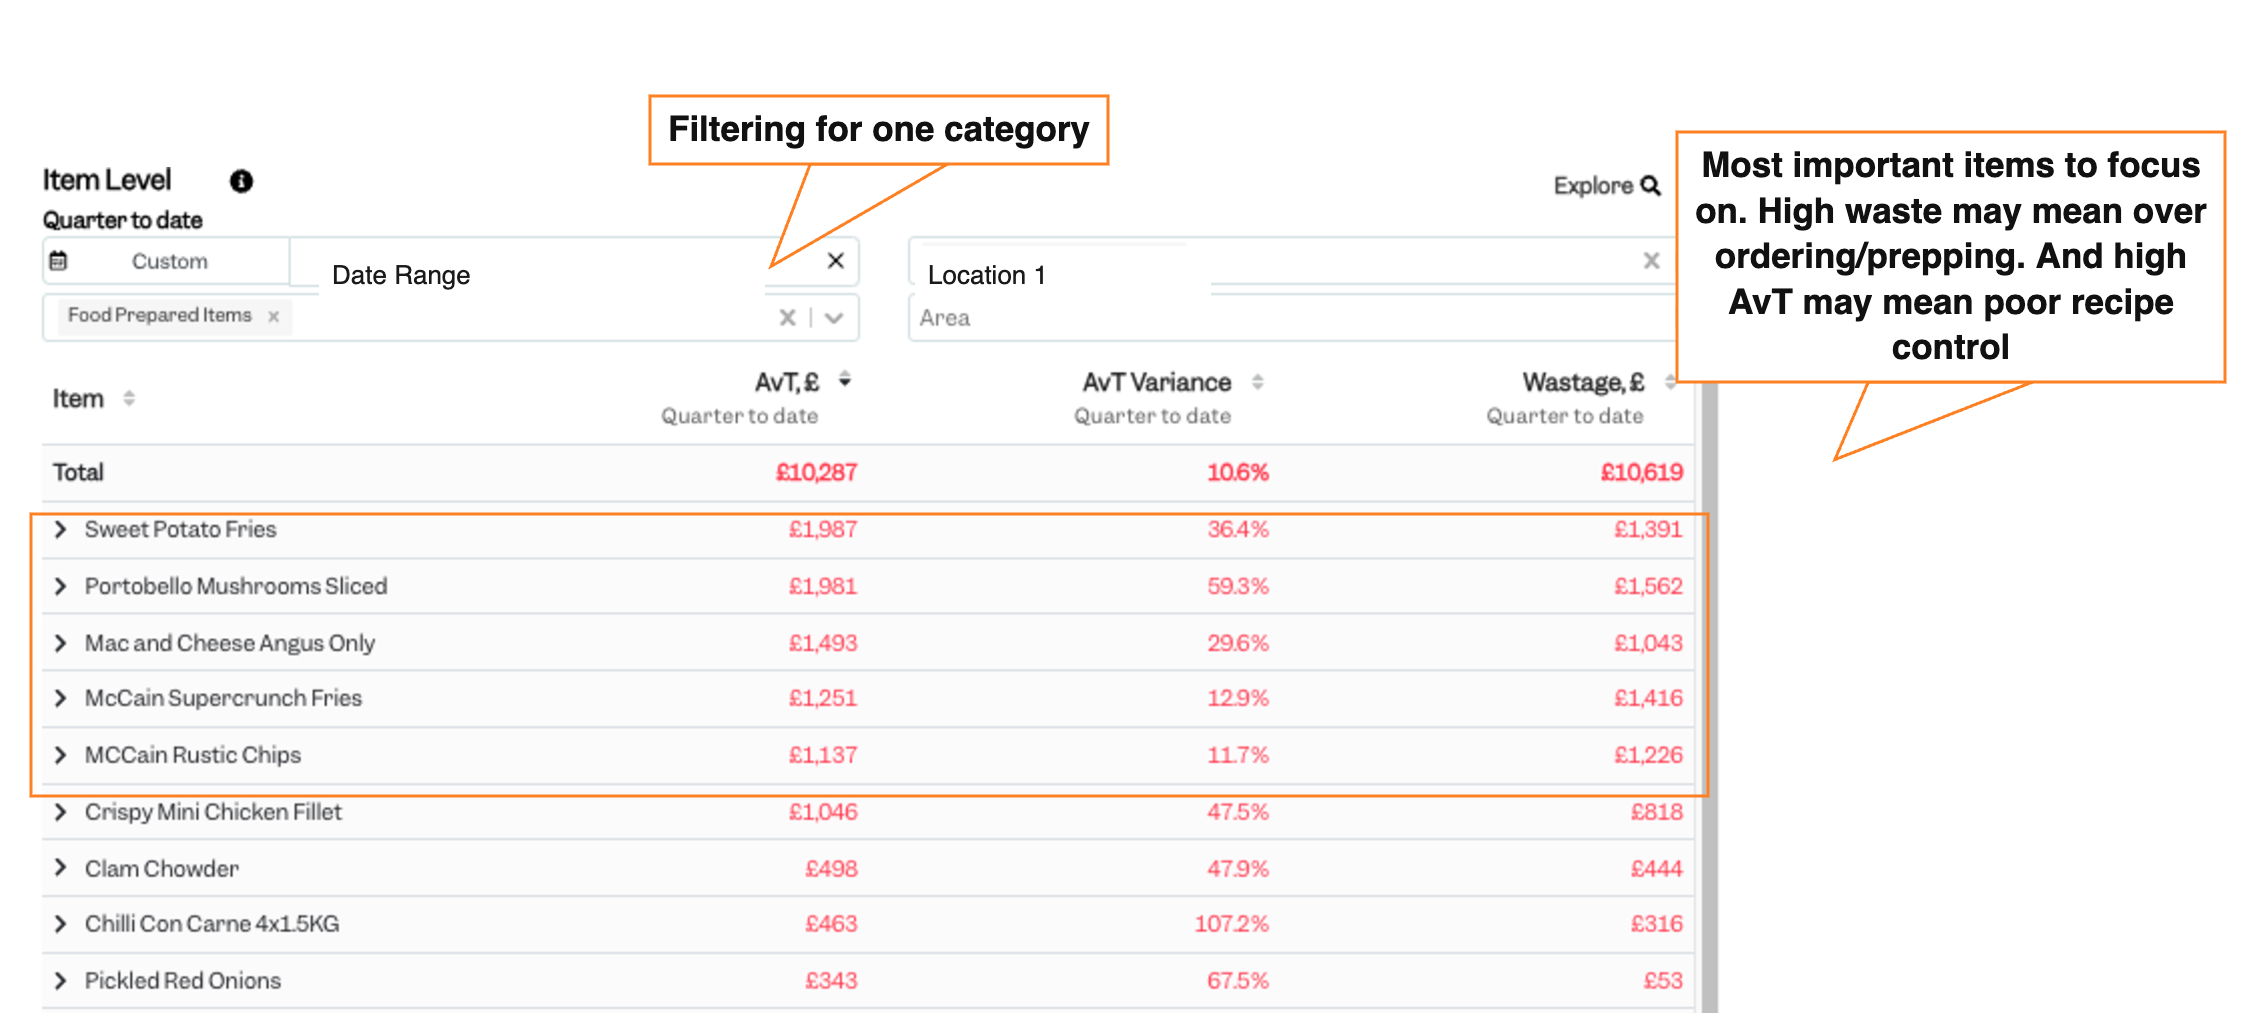
Open the category and read both columns per item — AvT variance next to recorded wastage. High AvT with low wastage means recipes are not being followed. High wastage means poor prep, poor plating, or theft. Chilli con carne ran 107% variance here and sliced portobello mushrooms 59%, so that is a spec-and-training conversation with the kitchen, not a purchasing one. The two columns read together tell you which conversation to have.
Compare that one item back across every site #
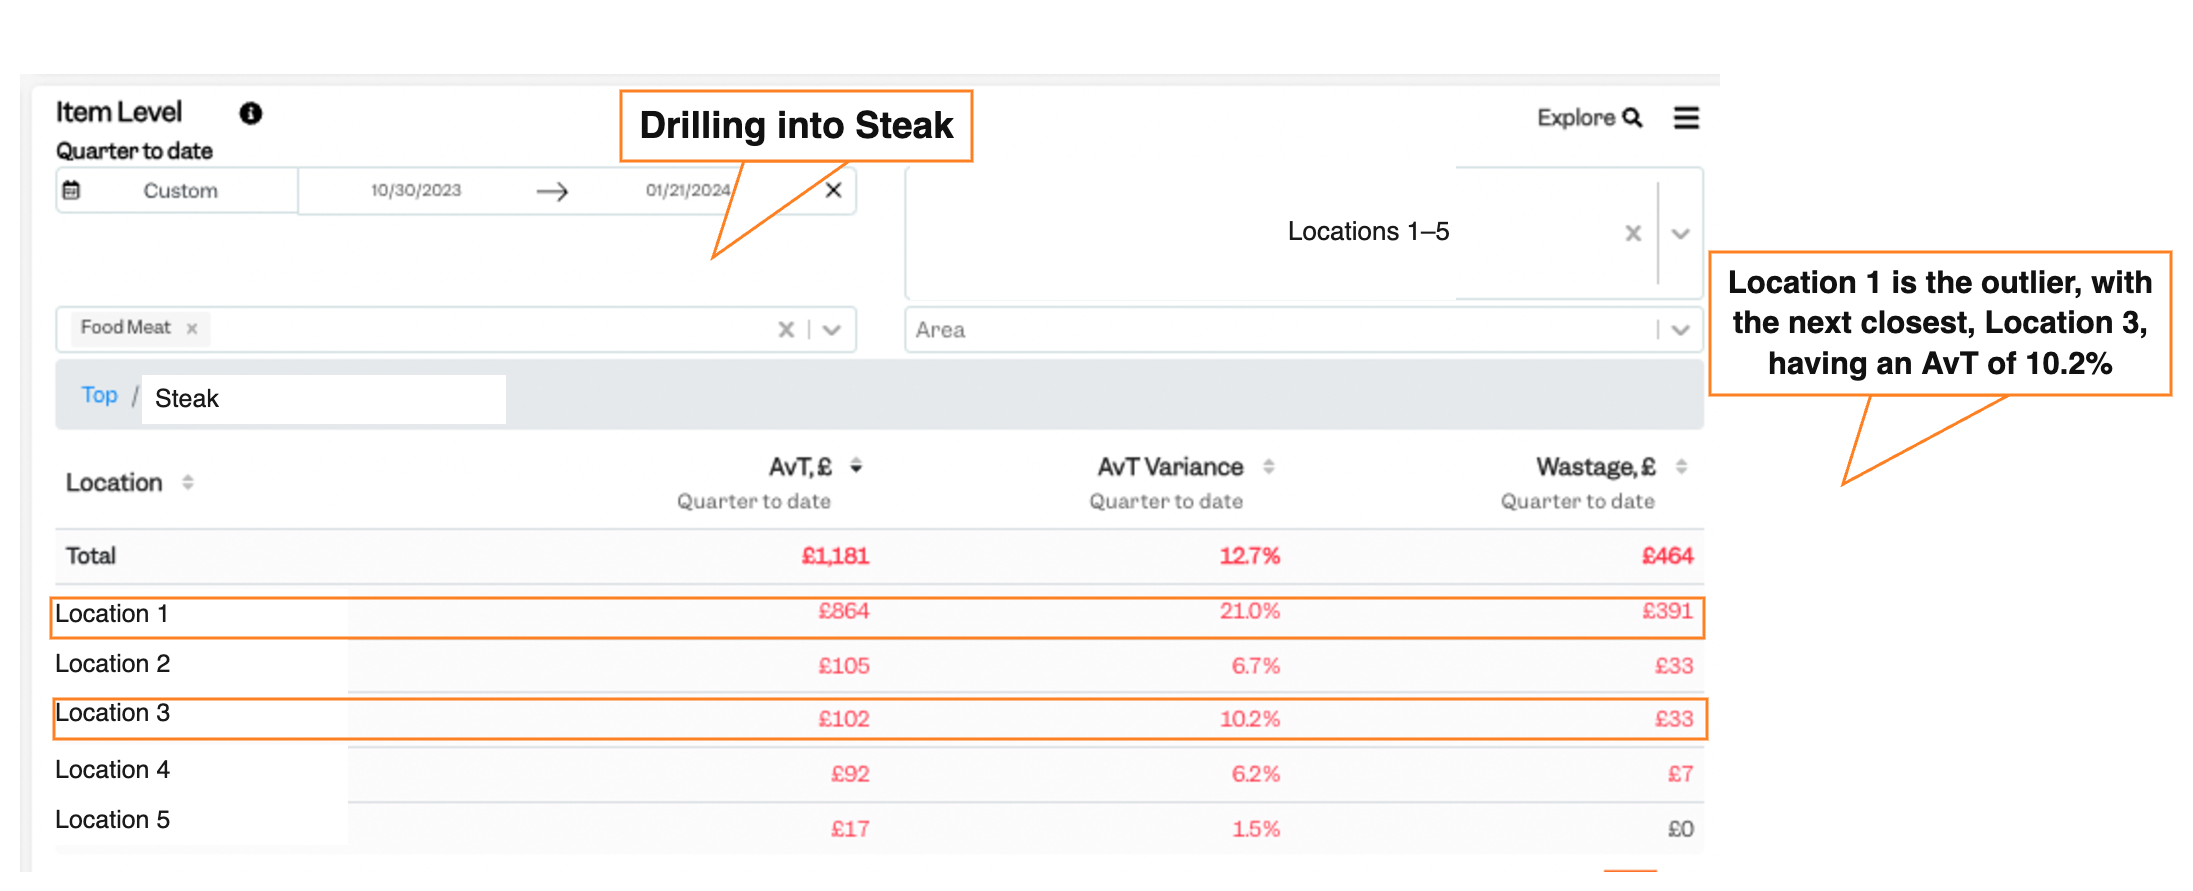
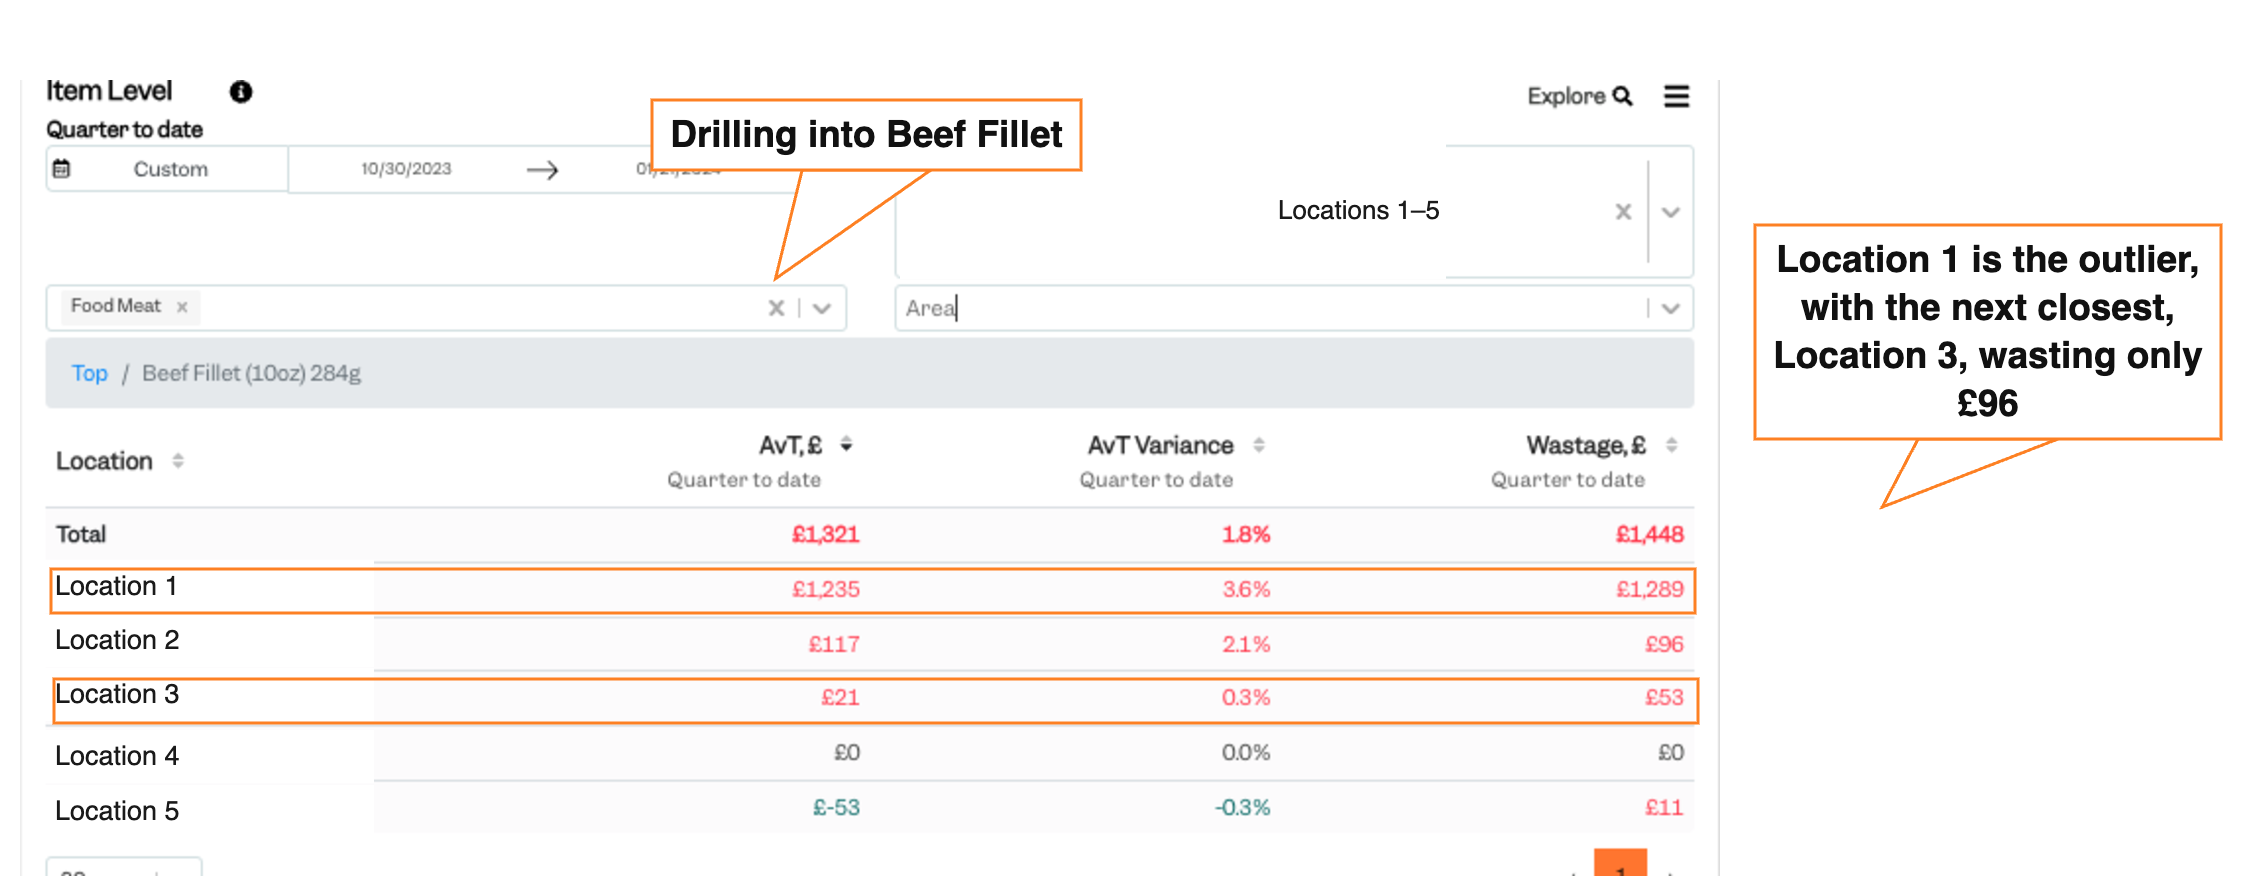
This is the step that answers the question. Take one of those items and pull it across every site. Same recipe, same spec, same supplier — so a site out of line on its own has a cause local to that site. Steak ran 21% AvT at the outlier against 1.5% to 10.2% everywhere else, £864 against £17 to £105. Beef fillet told the same story: £1,235 at one site, £117 at the next, and £0 at two others. One item, every site, same spec. That comparison is what turns a variance number into a conversation with a named site — and it narrows the cause without accusing anyone.
What is AvT (actual versus theoretical) in restaurant inventory? #
AvT compares the stock you actually used against the stock your sales say you should have used. The theoretical figure is calculated from what you sold and the recipe behind each dish; the actual figure comes from purchases and stock counts. The gap between them is the variance. In pounds it tells you the size of the problem; as a percentage of usage it tells you how serious it is relative to the volume moving through that item. Recorded wastage is tracked separately, because a logged bin is a different problem from stock that simply is not there.
How do you tell the difference between food waste and theft in a restaurant? #
Look at recorded wastage and AvT variance separately, then compare the same item across sites. High wastage points to over-ordering, over-prepping or spoilage — a purchasing and production problem. High AvT means the stock left the store room but the sales do not account for it, which can be recipe drift, inconsistent portioning, items rung up incorrectly, or loss. The way to narrow it is the site comparison: if one site runs 21% variance on a cut of steak while four others on the same recipe and spec run between 1.5% and 10%, the cause is local to that site rather than to the recipe or the supplier. That does not prove theft, but it tells you precisely where to look and what to ask.
What is an acceptable food cost variance for a restaurant? #
Judge it against your own sites rather than against an industry figure. Variance depends on how much prep is done in-house, how tightly recipes are specified, how often you count stock, and how much of the item moves — an item at 3.6% variance on high volume can matter less than one at 21% on low volume. The more useful test is dispersion: pull the same item across every site and look at the spread. Sites running the same recipe should land in the same band, and the ones that do not are the ones to investigate.
How do you find out which site is losing stock? #
Drill from site to category to item, then reverse the drill and compare that single item across all sites. Site totals tell you where to start but not what is wrong. Category level narrows it and lets you discard the noise, such as soft drinks variance that is really staff drinks. Item level identifies the specific product. The final step — one item, every site, same spec — is what isolates the cause, because anything appearing at one site and not the others cannot be the recipe or the supplier.
What data do you need to run an inventory variance analysis? #
Three things: POS sales at item level, recipes or specs so theoretical usage can be calculated, and actual stock counts plus purchase data. Tenzo joins these from your POS and your stock or purchasing system — R365, MarginEdge, Procure Wizard and similar — so AvT and wastage sit alongside sales in one place. Without recipes there is no theoretical figure and therefore no AvT at all; without regular counts the actual side drifts and the variance becomes noise rather than signal.


