
- Quick Win: Negotiate Based on Volume
- Track price changes & focus on the top items
- Use AI and Tenzo MCP to unlock more insights
- Find the same item, same supplier, at a different price by site
- Then find the items you're buying five different ways
- Hand each site ten switches, not a league table
- Run this on your own data
- How do you reduce food costs in a multi-site restaurant group without renegotiating with suppliers?
- Why do different restaurant locations pay different prices for the same product?
- What is a true unit cost, and why does it matter for purchasing?
- Can AI analyse restaurant purchasing data?
- How do you know a purchasing saving is real and not a data problem?
Every multi-site group pays several different prices for the same item, and almost nobody knows which ones. This recipe works out what each site actually pays per unit — same item, same supplier, same pack — then ranks the gaps by what closing them is worth.
In the worked example below, eleven stores were buying the 72 items most of them need in 291 different ways, with $24,116 per 28 days on the table from standardising alone.

“Thanks to Tenzo, we’ve gained about three percentage points on our prime costs, which goes straight to the bottom line.”
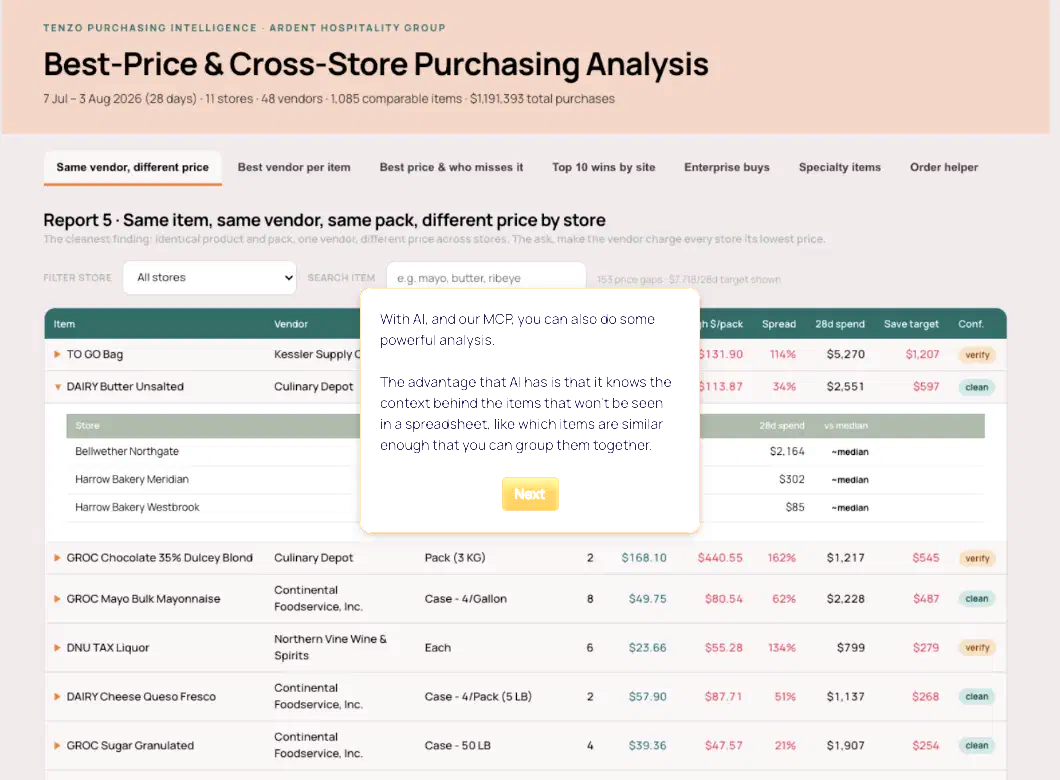
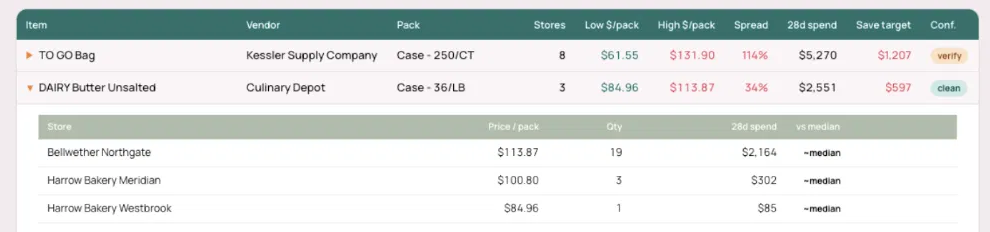
One supplier, one pack, three stores, three prices. Unsalted butter at $84.96 a case in one store and $113.87 in another — a 34% spread on the same line.
Quick Win: Negotiate Based on Volume #
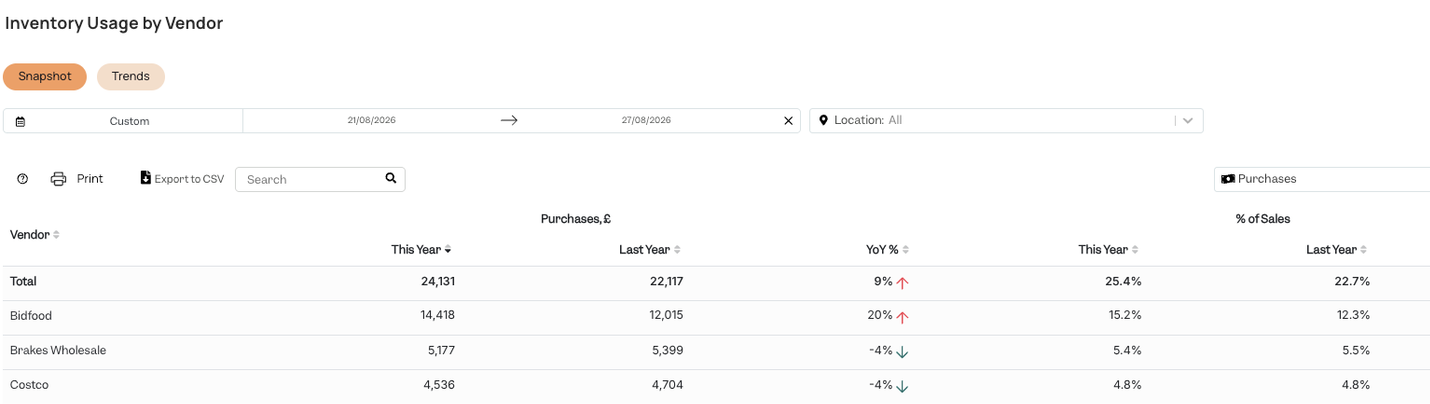
The quickest win for most restaurants sits in the vendor data. Find the suppliers where your spend has grown year over year, then go back and negotiate a better volume discount off the back of that growth.
Track price changes & focus on the top items #
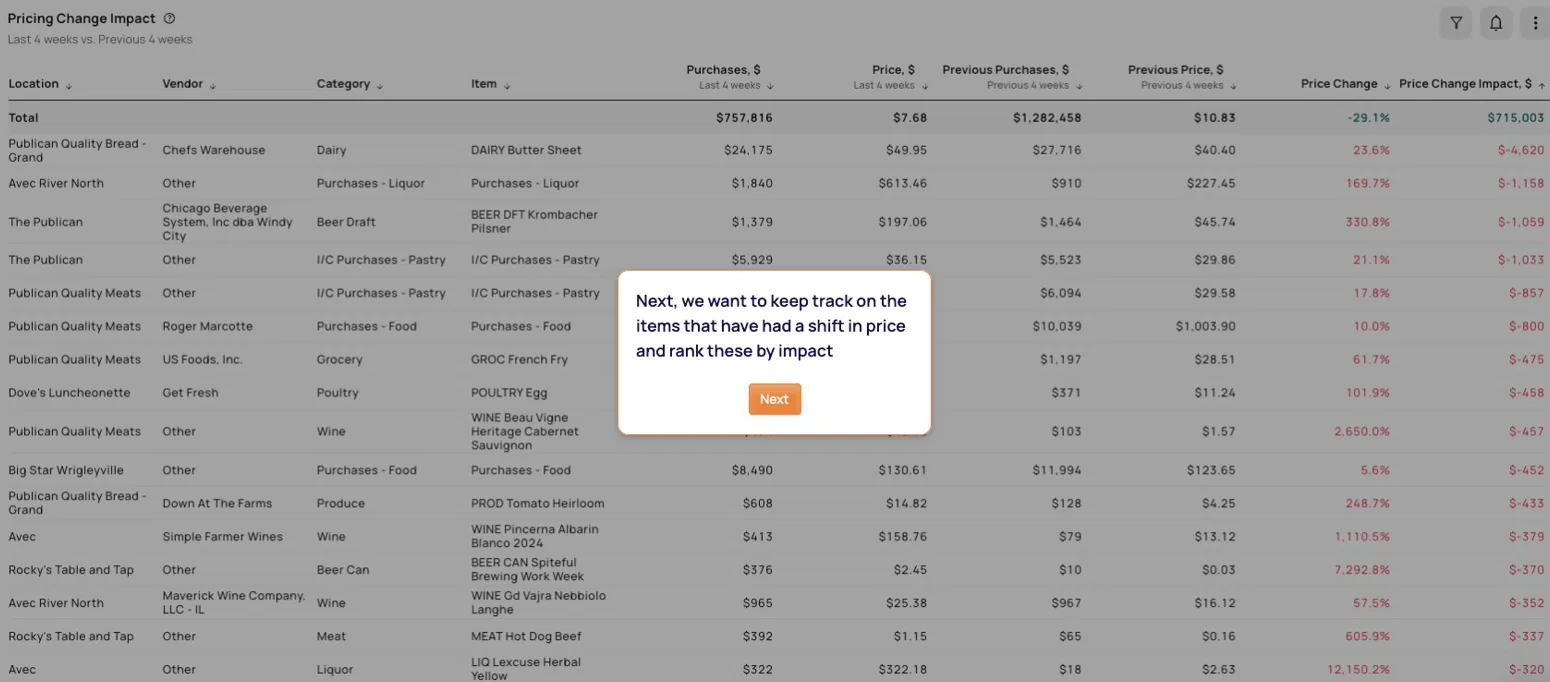
Suppliers move prices constantly and almost none of it matters. Sorting by percentage buries the real problem under noise — a wine going up 2,650% on £100 of spend is a rounding error, while butter up 23.6% on $24,175 of spend is the single biggest line on the page. Sort by impact in pounds and a list of thousands of purchases becomes a list of about ten worth a phone call. Most groups don’t have the capacity to focus on everything, so it’s a major unlock to focus on the biggest shifts
Use AI and Tenzo MCP to unlock more insights #
This is where a spreadsheet gives up. Comparing a case of 6 packs of 5 lb against a case of 24 cans of 7.2 fl oz means reading the pack description, converting to a true unit cost, and knowing which items are similar enough to sit in the same comparison at all. AI over the Tenzo MCP does that judgement work — it carries the context a column of numbers cannot, which is what turns raw purchasing data into 1,085 genuinely comparable items across 48 vendors. The hard part was never the arithmetic. It was knowing which two things are the same thing.
Find the same item, same supplier, at a different price by site #
The cleanest finding in purchasing, and the most common in multi-brand groups. Identical product, identical pack, one supplier, different price per store — here unsalted butter from one supplier runs $84.96 a case at one store and $113.87 at another, a 34% spread on $2,551 of spend. Across the group that pattern shows up 153 times and is worth $7,718 every 28 days. Nothing needs renegotiating: the ask is simply that the supplier charges every store its lowest price. You are not asking for a discount. You are asking to be charged the price you are already being charged somewhere else.
Then find the items you’re buying five different ways #
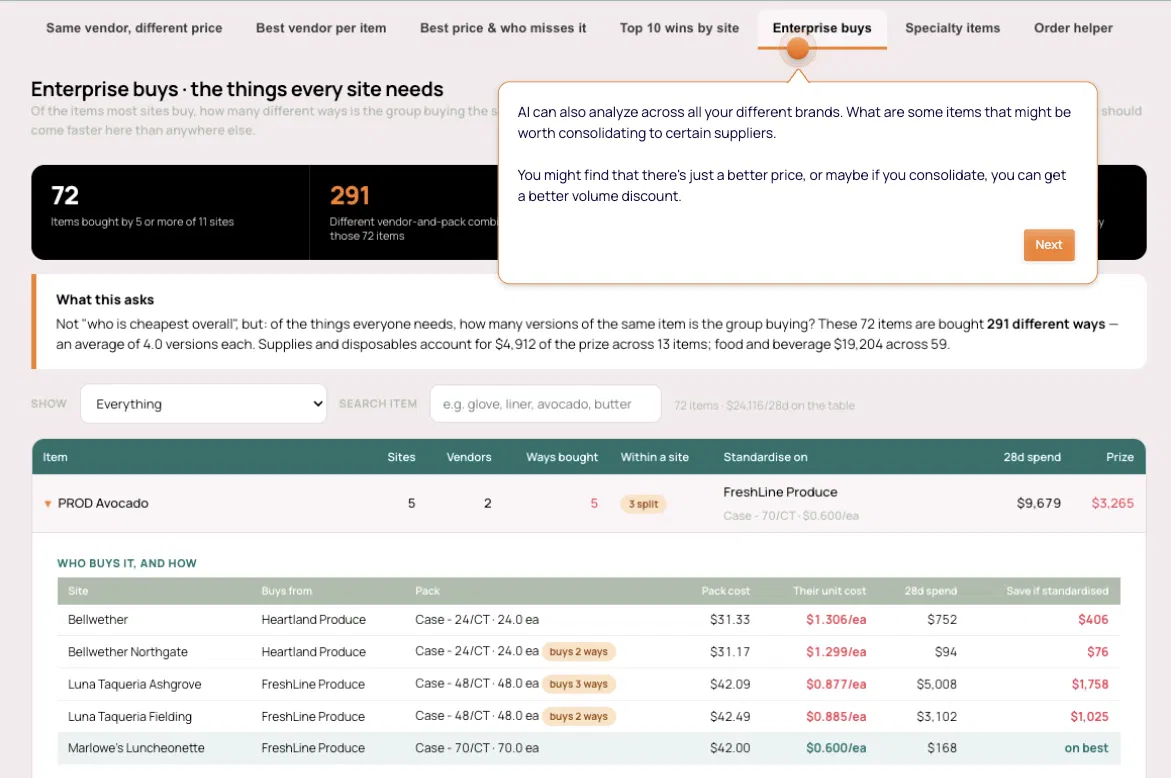
Of the things every site needs, how many versions of each is the group actually buying? Here 72 items are bought 291 different ways — an average of four versions each — and standardising them is worth $24,116 per 28 days. Avocado alone is bought five ways from two suppliers across five sites, at unit costs from $0.600 to $1.306 each. Nobody’s recipe depends on which case the avocados arrive in, so agreement should come faster here than anywhere else. Four versions of one product across a group is normal. It is also where the quiet money is.
Hand each site ten switches, not a league table #
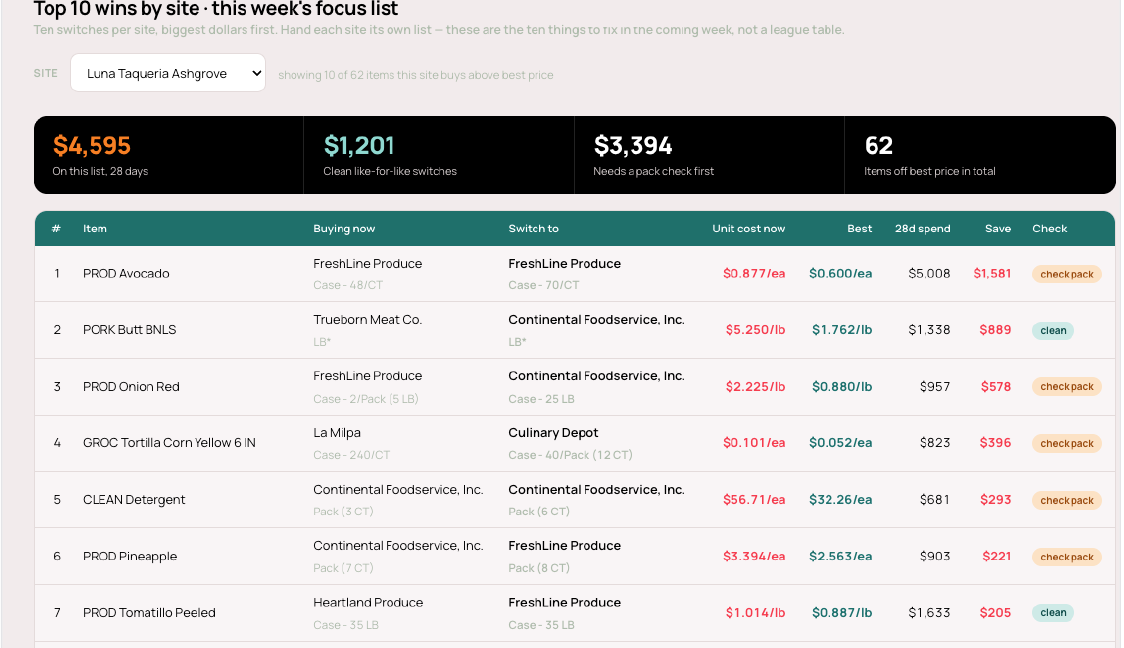
Group totals are for the board. An ordering manager needs a list: what you buy now, what to switch to, both unit costs, and the money. One site here has 62 items off best price, and the top ten carry $4,595 over 28 days — of which $1,201 is clean like-for-like and $3,394 needs a pack check first. Splitting those two numbers is what stops the analysis being argued with. Give them two totals, never one. Realistic is what you can bank this week; ceiling is what the prize looks like.
Run this on your own data #
Paste this into Claude with the Tenzo connector switched on and it will do the analysis above against your own purchasing. Takes about ten minutes. You need a Claude account with a code environment — Cowork or Claude Code, since plain chat cannot hold this much data — and the Tenzo connector added under Settings → Connectors.
You are a restaurant purchasing analyst. Using the Tenzo
connector, pull my purchase data and find where we are paying
more than we need to for items we already buy.

SETUP
Work in a code environment, not in plain chat — the dataset is
too large to hold in context. Pull once, save to disk, then
analyse from file.

1. Pull purchases for the last 28 complete days, by store,
   vendor and item, with: item code, item description, vendor,
   pack description, quantity received, unit of measure, and
   total spend.
2. Save the raw pull before you touch it. Every number you
   report to me must be traceable back to it.

STEP 1 — NORMALISE TO A TRUE UNIT COST
Price per pack is spend divided by quantity received. That is
not comparable across stores. Read the pack description and
convert to a true unit cost:

   "Case - 6/Pack (5 LB)"     = 30 LB per case
   "Case - 24/CT (7.2 FL OZ)" = 172.8 FL OZ per case
   "Case - 48/CT"             = 48 each

Express every line as cost per LB, per FL OZ or per each.
Where the unit of measure is a weight but the item is billed
catch-weight, handle it separately and say so — do not
silently mix it in with the fixed-weight lines.

STEP 2 — DECIDE WHAT IS COMPARABLE
Group items that are genuinely the same product at the same
grade. Matching descriptions are not enough: different item
codes across stores frequently hold the same product, and one
item code sometimes holds several. Use judgement, and record
the groups you formed so I can check them.

Exclude the following, and list them separately rather than
dropping them silently:

 - Items bought in inconsistent units across sites. These go
   on a "needs standardising" list, not into the savings.
 - Items where the cheapest option is a different pack, grade
   or brand. Flag these "check pack" and keep them out of the
   headline number.
 - Any unit cost more than about three times the median for
   its group. Treat it as a likely data-entry error and tell
   me which invoice to check.
 - Named farms, single-source producers and specialty items.
   These are usually a deliberate choice, not an overpayment.

STEP 3 — THREE FINDINGS, IN THIS ORDER

A. Same item, same vendor, same pack, different price by
   store. The cleanest finding. For each: item, vendor, pack,
   number of stores, low and high price per pack, spread as a
   percentage, 28-day spend, and the saving if every store
   paid the lowest price already being charged somewhere in
   the group. Total it.

B. Items the group buys several different ways. Restrict to
   items bought by at least half the sites. For each: how many
   sites, how many vendors, how many distinct vendor-and-pack
   combinations, the recommended standard, and the saving from
   standardising on it. Total it.

C. A switch list per site. For each store, the ten items with
   the largest 28-day saving. Columns: what they buy now
   (vendor, pack, unit cost), what to switch to (vendor, pack,
   unit cost), 28-day spend, saving, and a flag of either
   "clean" for like-for-like or "check pack".

STEP 4 — REPORT TWO TOTALS, NEVER ONE
   Realistic — clean like-for-like switches only.
   Ceiling   — including everything that needs a pack check
               first.

Report them separately, with the item count behind each. A
single blended number will be argued with, and you will lose
that argument.

OUTPUT
A short summary with both totals, then the three findings as
tables, then the excluded items with the reason for each
exclusion. Tell me plainly what you were unsure about and
where you had to make a judgement call.

WHAT THIS WILL NOT DO
This gives you a point-in-time answer. It will not tell you
whether the savings actually landed, alert you when a price
moves again, or remember the standardisation decisions so
that next month's run starts where this one finished. That
needs the data held in one place permanently, rather than in
a prompt.
How do you reduce food costs in a multi-site restaurant group without renegotiating with suppliers? #
Compare what each of your sites actually pays per unit for the same item and close the gaps. Most multi-site groups have two findings sitting in their purchasing data before any negotiation starts: the same supplier charging different stores different prices for an identical pack, and the group buying one product several different ways. Neither needs a new contract. In a worked example across eleven stores, the first pattern appeared 153 times and was worth $7,718 per 28 days, and standardising the 72 items most sites buy was worth a further $24,116.
Why do different restaurant locations pay different prices for the same product? #
Usually because pricing was agreed site by site, at different times, by different people — and nothing since has compared them. It is most common in multi-brand groups, where each brand built its own supplier relationships before the group centralised. Add pack-size variation and it becomes invisible: two stores buying the same butter in a 36 lb case at $84.96 and $113.87 look like two unrelated invoice lines until someone puts them on the same row.
What is a true unit cost, and why does it matter for purchasing? #
True unit cost is what you pay per pound, per fluid ounce or per each — after unpacking the case. Price per pack is spend divided by quantity received, which is easy; converting that to a comparable unit means reading the pack description, so a case of 6 packs of 5 lb becomes 30 lb and a case of 24 cans of 7.2 fl oz becomes 172.8 fl oz. Without that conversion you cannot tell whether a cheaper case is actually cheaper, and catch-weight items billed by weight have to be handled differently again.
Can AI analyse restaurant purchasing data? #
Yes, and it is genuinely better suited to this than a spreadsheet, because most of the work is judgement rather than arithmetic. Deciding which items are similar enough to compare, reading contents out of a pack description, spotting that one item code is holding several different products, and recognising that a named farm or single-source producer is a deliberate choice rather than an overpayment — none of that is a formula. Connected to Tenzo over the MCP, Claude can do the analysis against your own purchasing data; there is a copy-paste prompt on this page to run it yourself.
How do you know a purchasing saving is real and not a data problem? #
Exclude before you calculate. Four rules do most of the work: if an item is bought in inconsistent units across sites, it cannot be compared and belongs on a “needs standardising” list rather than in the savings; if the cheapest option is a different pack or grade, flag it for a pack check and keep it out of the headline number; if one site’s unit cost is more than about three times the median, treat it as a likely data-entry error and check the invoice; and if one item code clearly holds several products, the catalogue needs splitting rather than the supplier being accused. Report a realistic total and a ceiling total separately, and never blend them.


