
- Rank sites by discount percentage, and watch the trend
- Drill into employees, normalised against their own sales
- Open the actual transactions before you draw a conclusion
- Read tip and service charge percentage by employee
- Track voids and discounts by item, not by person
- How do you spot employee theft in a restaurant POS?
- What is a normal discount percentage for a restaurant?
- Why measure discounts as a percentage of employee sales rather than in cash?
- What does a low tip percentage for one employee actually mean?
- How do you tell a genuine goodwill discount from discount abuse?
Every group has discounts and voids it cannot account for, and most treat the total as a cost of doing business. This recipe works down from site to employee to individual transaction — normalised for sales volume and filtered to in-store trade only — so you can tell whether an outlier is a manager being generous, a kitchen running slow, or something that needs a conversation.
A multi-brand UK hospitality group recovered around £50,000 a year after auditing discounts and voids by site and by employee.
Rank sites by discount percentage, and watch the trend #
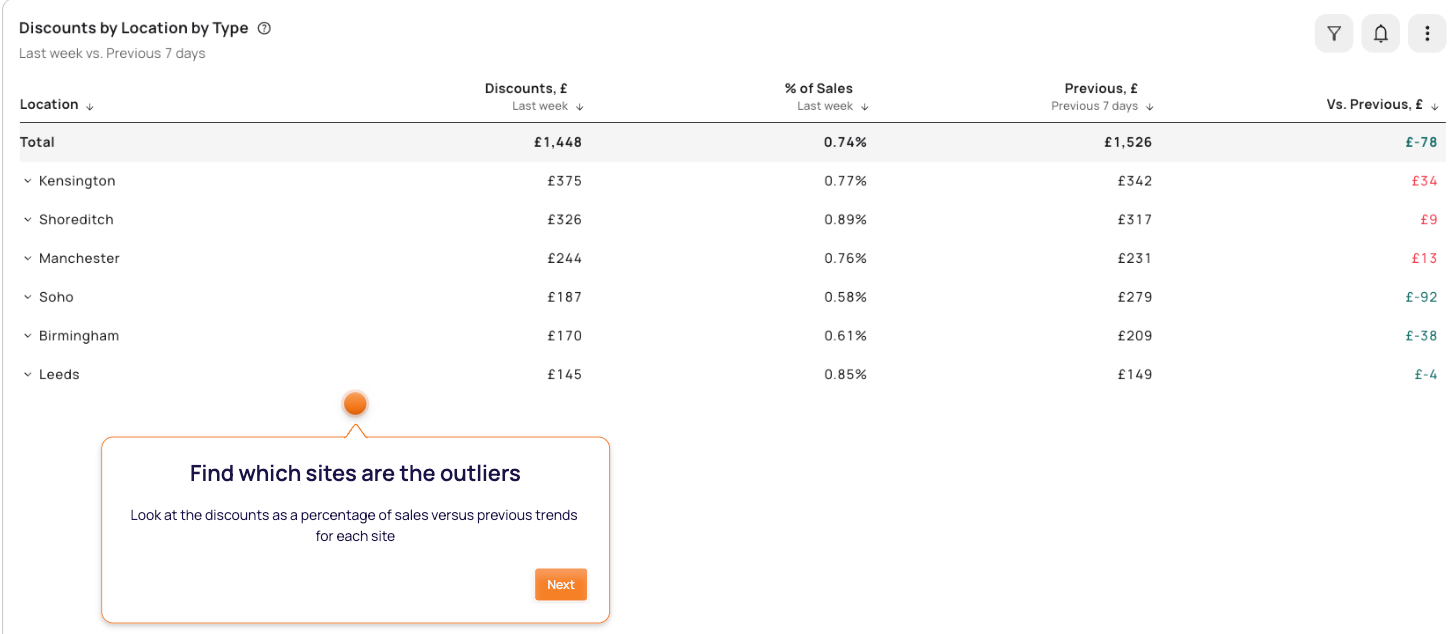
Start at site level, and use discount as a percentage of sales rather than the cash total — your biggest site will always discount most in pounds. You are looking for two things: the site sitting clearly above its peers, and the site whose line is climbing.
Drill into employees, normalised against their own sales #
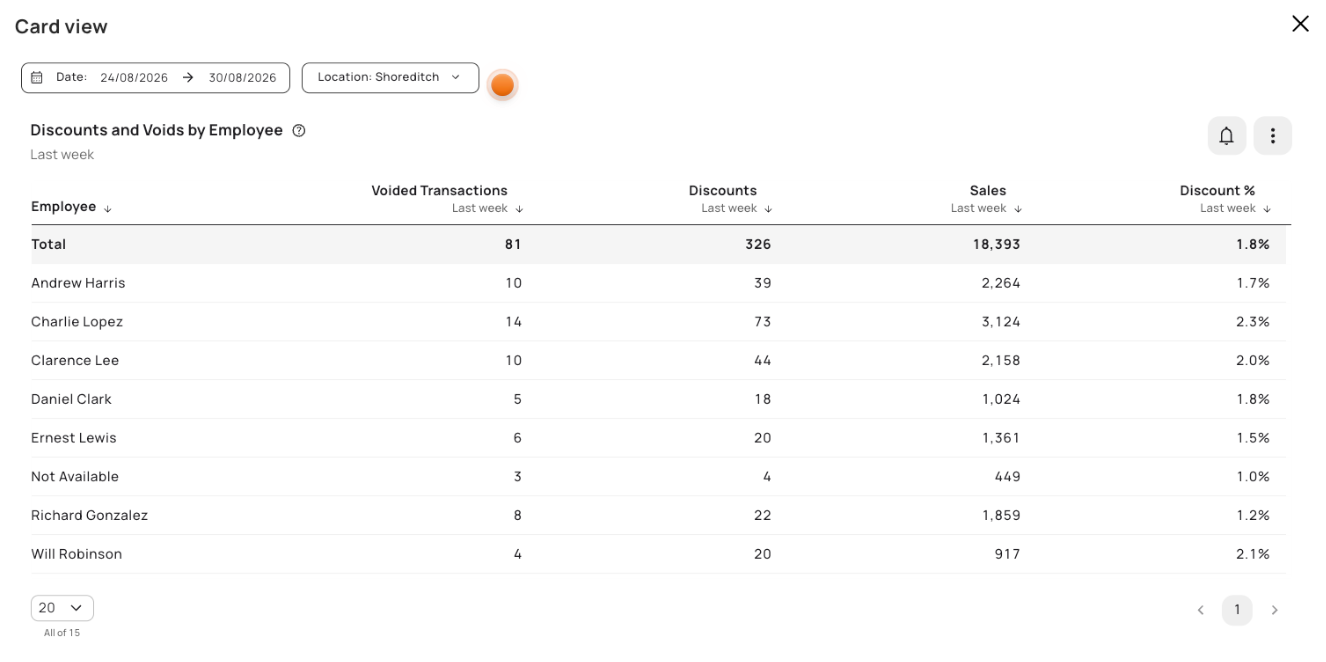
Within the outlier site, rank employees on discounts and voided transactions as a percentage of their own sales. Two filters decide whether this step is useful or misleading: normalise to each employee’s sales, and look at in-store transactions only — delivery channels carry their own native discounting and will pull the whole comparison out of shape. In this example the site averages 1.8% and the top employee sits at 2.3% across 14 voids, which is a mild outlier worth opening rather than an alarm. An unnormalised list just tells you who works the most shifts.
Open the actual transactions before you draw a conclusion #
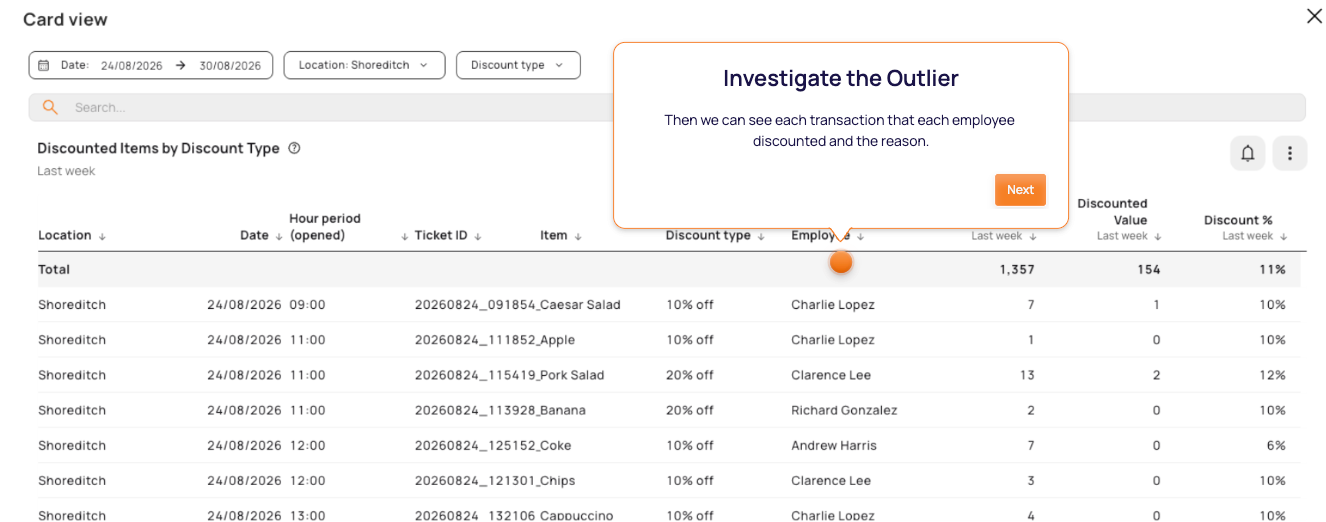
A rank order is a hypothesis, not a finding. Drill into every discount one person applied and read what it was on, which code was used, how much, and at what time — a scatter of goodwill desserts across one bad service week is a different story from the same code on the same item at the same point in every shift. This is the step that decides whether you have a training conversation, a kitchen problem, or something else entirely. Never take a name into a conversation without the transactions behind it.
Read tip and service charge percentage by employee #
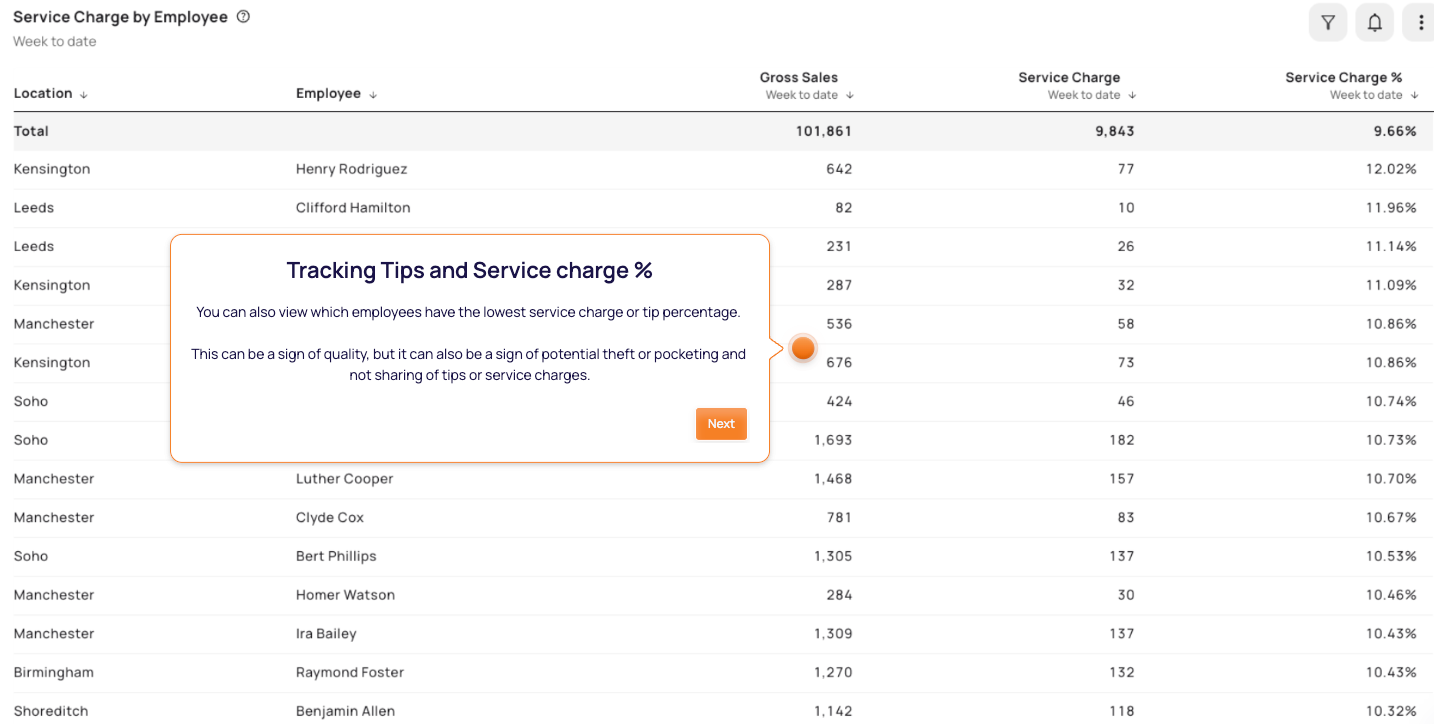
Tip and service charge percentage per employee is the other half of this picture, but only on comparable trade. Slice it so you are reading like for like: exclude takeaway, exclude delivery, dine-in only, where a tip is expected — otherwise every average gets flattened by trade where nobody tips.
A server consistently below colleagues working the same shifts and the same section is worth understanding, and it reads two ways: guests who were less happy with the service, or takings that did not fully arrive. Neither reading is safe on its own. The value is that the number is visible at all. Tip percentage is a service metric and a control metric at once. Which one it is depends on what else you find.
Track voids and discounts by item, not by person #
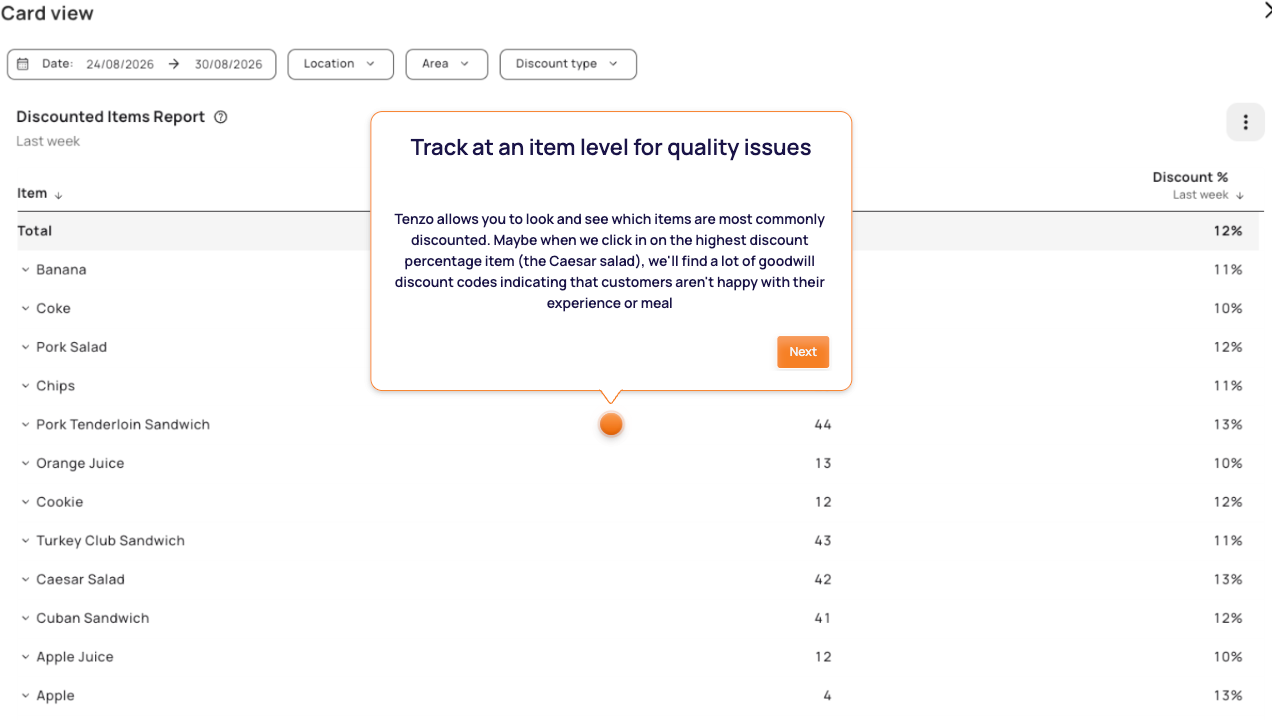
Finally, flip the axis: which items get discounted or voided most often, and where. This one usually is not about people at all. An item that keeps getting comped is normally taking too long to reach the table or arriving in a state guests mention — and the pattern tells you where to look. The same dish across several sites points at the recipe or the spec; the same dish at one site points at that kitchen. When the same item keeps getting discounted, the problem is the item. When the same person keeps discounting, it might not be.
How do you spot employee theft in a restaurant POS? #
Work top down and normalise at every level: rank sites by discount and void percentage, then employees within the outlier site as a share of their own sales, then open the individual transactions. Patterns matter far more than totals — the same discount code on the same item at the same point in a shift, voided transactions clustered around one person, or a tip percentage well below colleagues working the same section. None of these is proof on its own, which is exactly why the transaction-level detail is the step you never skip.
What is a normal discount percentage for a restaurant? #
There is no universal figure, and hunting for one is the wrong instinct. Discount rates vary with format, with how much trade runs through delivery channels that carry their own promotional pricing, and with how much authority sites have to comp. The comparison that works is internal: your own sites against each other on the same basis, and each site against its own trend. A site a few points above its peers, or a line climbing across a quarter, tells you more than any published benchmark.
Why measure discounts as a percentage of employee sales rather than in cash? #
Because a cash ranking simply finds your busiest staff. Someone working five shifts a week will always discount more in absolute terms than someone working two, so an unnormalised leaderboard puts your hardest workers at the top and reads like an accusation. Dividing each person’s discounts by their own sales takes shift volume out of the picture, and it is the single change that makes the list fit to show anyone.
What does a low tip percentage for one employee actually mean? #
On its own, nothing conclusive — which is why it belongs next to the discount and void data rather than standing alone. Read on dine-in transactions only, with takeaway and delivery excluded, an employee consistently below colleagues on comparable shifts is a signal with two plausible readings: guests who were less satisfied with the service, or takings that did not fully reach the till. It is a prompt to look further, never a verdict.
How do you tell a genuine goodwill discount from discount abuse? #
The transaction detail, and the shape of the pattern in it. Goodwill discounting tends to be varied and event-shaped — different items, different amounts, clustered around a bad service or a kitchen problem other people also reported. Abuse tends to be repetitive: the same code, similar amounts, often the same item and the same quiet point in a shift. Before concluding anything, check whether the item itself is the common factor across sites, because an item comped everywhere is a spec problem rather than a staff one.


